Neiman Marcus 2010 Annual Report Download - page 28
Download and view the complete annual report
Please find page 28 of the 2010 Neiman Marcus annual report below. You can navigate through the pages in the report by either clicking on the pages listed below, or by using the keyword search tool below to find specific information within the annual report.-
 1
1 -
2
-
3
-
4
-
5
-
6
-
7
-
8
-
9
-
10
-
11
-
12
-
13
-
14
-
15
-
16
-
17
-
 18
18 -
 19
19 -
 20
20 -
 21
21 -
 22
22 -
 23
23 -
 24
24 -
 25
25 -
 26
26 -
 27
27 -
 28
28 -
 29
29 -
 30
30 -
 31
31 -
 32
32 -
 33
33 -
 34
34 -
 35
35 -
 36
36 -
 37
37 -
 38
38 -
39
-
40
-
41
-
42
-
43
-
44
-
45
-
46
-
47
-
48
-
49
-
50
-
51
-
52
-
53
-
54
-
55
-
56
-
57
-
58
-
59
-
60
-
61
-
62
-
63
-
64
-
65
-
66
-
67
-
68
-
69
-
70
-
71
-
72
-
73
-
74
-
75
-
76
-
77
-
78
-
79
-
80
-
81
-
82
-
83
-
84
-
85
-
86
-
87
-
88
-
89
-
90
-
91
-
92
-
93
-
94
-
95
-
96
-
97
-
98
-
99
-
100
-
101
-
102
-
103
-
104
-
105
-
106
-
107
-
108
-
109
-
110
-
111
-
112
-
113
-
114
-
115
-
116
-
117
-
118
-
119
-
120
-
121
-
122
-
123
-
124
-
125
-
126
-
127
-
128
-
129
-
130
-
131
-
132
-
133
-
134
-
135
-
136
-
137
-
138
-
139
-
140
-
141
-
142
-
143
-
144
-
145
-
146
-
147
-
148
-
149
-
150
-
151
-
152
-
153
-
154
-
155
-
156
-
157
-
158
-
159
-
160
-
161
-
162
-
163
-
164
-
165
-
166
-
167
-
168
-
169
-
170
-
171
-
172
-
173
-
174
-
175
-
176
-
177
-
178
-
179
-
180
-
181
-
182
-
183
-
184
-
185
 |
 |
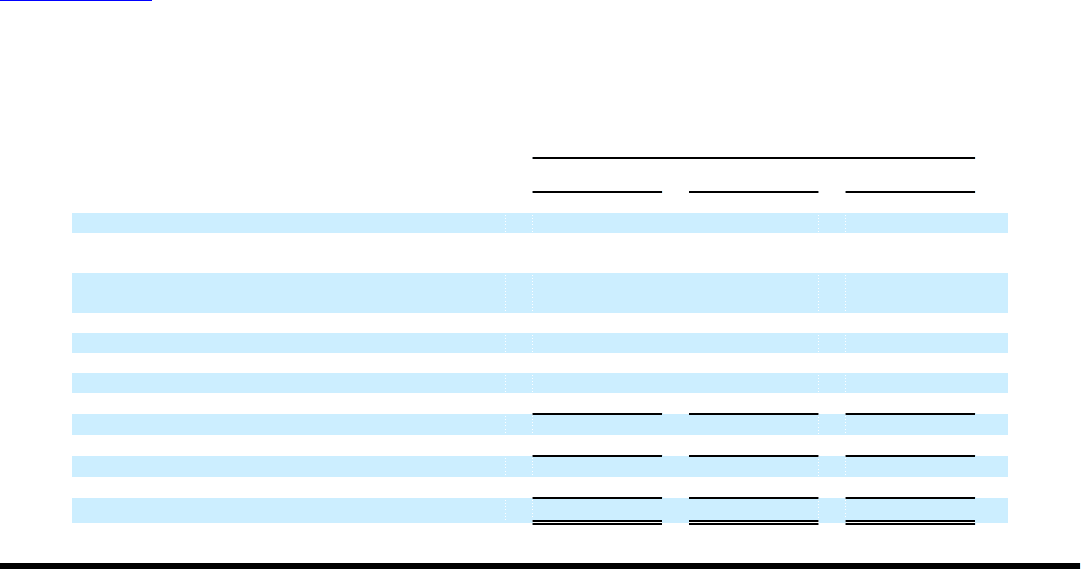
Table of Contents
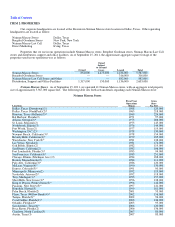
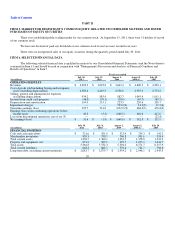
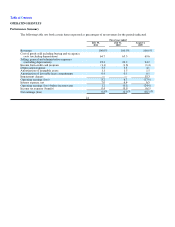
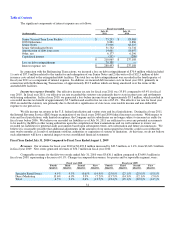
OPERATING RESULTS
Performance Summary
The following table sets forth certain items expressed as percentages of net revenues for the periods indicated.
Fiscal year ended
July 30,
2011
July 31,
2010
August 1,
2009
Revenues 100.0% 100.0% 100.0%
Cost of goods sold including buying and occupancy
costs (excluding depreciation) 64.7 65.5 69.6
Selling, general and administrative expenses
(excluding depreciation) 23.3 24.0 24.2
Income from credit card program (1.1) (1.6) (1.4)
Depreciation expense 3.3 3.8 4.1
Amortization of intangible assets 1.1 1.5 1.5
Amortization of favorable lease commitments 0.4 0.5 0.5
Impairment charges — — 19.3
Operating earnings (loss) 8.2 6.3 (17.9)
Interest expense, net 7.0 6.4 6.5
Operating earnings (loss) before income taxes 1.2 (0.1) (24.4)
Income tax expense (benefit) 0.4 (0.1)(6.1)
Net earnings (loss) 0.8%(0.0)% (18.3)%
24