Neiman Marcus 2010 Annual Report Download - page 103
Download and view the complete annual report
Please find page 103 of the 2010 Neiman Marcus annual report below. You can navigate through the pages in the report by either clicking on the pages listed below, or by using the keyword search tool below to find specific information within the annual report.-
 1
1 -
2
-
3
-
4
-
5
-
6
-
7
-
8
-
9
-
10
-
11
-
12
-
13
-
14
-
15
-
16
-
17
-
18
-
19
-
20
-
21
-
22
-
23
-
24
-
25
-
26
-
27
-
28
-
29
-
30
-
31
-
32
-
33
-
34
-
35
-
36
-
37
-
38
-
39
-
40
-
41
-
42
-
43
-
44
-
45
-
46
-
47
-
48
-
49
-
50
-
51
-
52
-
53
-
54
-
55
-
56
-
57
-
58
-
59
-
60
-
61
-
62
-
63
-
64
-
65
-
66
-
67
-
68
-
69
-
70
-
71
-
72
-
73
-
74
-
75
-
76
-
77
-
78
-
79
-
80
-
81
-
82
-
83
-
84
-
85
-
86
-
87
-
88
-
89
-
90
-
91
-
92
-
 93
93 -
 94
94 -
 95
95 -
 96
96 -
 97
97 -
 98
98 -
 99
99 -
 100
100 -
 101
101 -
 102
102 -
 103
103 -
 104
104 -
 105
105 -
 106
106 -
 107
107 -
 108
108 -
 109
109 -
 110
110 -
 111
111 -
 112
112 -
 113
113 -
114
-
115
-
116
-
117
-
118
-
119
-
120
-
121
-
122
-
123
-
124
-
125
-
126
-
127
-
128
-
129
-
130
-
131
-
132
-
133
-
134
-
135
-
136
-
137
-
138
-
139
-
140
-
141
-
142
-
143
-
144
-
145
-
146
-
147
-
148
-
149
-
150
-
151
-
152
-
153
-
154
-
155
-
156
-
157
-
158
-
159
-
160
-
161
-
162
-
163
-
164
-
165
-
166
-
167
-
168
-
169
-
170
-
171
-
172
-
173
-
174
-
175
-
176
-
177
-
178
-
179
-
180
-
181
-
182
-
183
-
184
-
185
 |
 |

Table of Contents
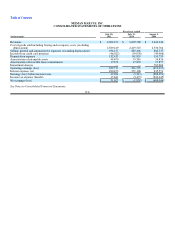
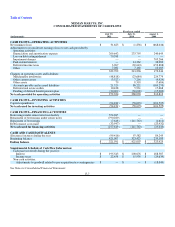
NEIMAN MARCUS, INC.
CONSOLIDATED STATEMENTS OF CASH FLOWS
Fiscal year ended
(in thousands)
July 30,
2011
July 31,
2010
August 1,
2009
CASH FLOWS—OPERATING ACTIVITIES
Net earnings (loss) $ 31,623 $ (1,838) $ (668,046)
Adjustments to reconcile net earnings (loss) to net cash provided by
operating activities:
Depreciation and amortization expense 209,642 233,795 240,645
Loss on debt extinguishment 70,388 — —
Impairment charges — — 703,266
Paid-in-kind interest — 14,362 38,082
Deferred income taxes 3,967 (39,643) (153,888)
Other 7,082 7,160 10,185
322,702 213,836 170,244
Changes in operating assets and liabilities:
Merchandise inventories (48,818) (23,684) 224,779
Other current assets (3,527) 7,216 (9,924)
Other assets 79 8,518 (7,684)
Accounts payable and accrued liabilities 21,520 86,221 (169,270)
Deferred real estate credits 10,428 5,931 17,668
Funding of defined benefit pension plan (30,000)(30,000)(15,000)
Net cash provided by operating activities 272,384 268,038 210,813
CASH FLOWS—INVESTING ACTIVITIES
Capital expenditures (94,181)(58,693)(101,525)
Net cash used for investing activities (94,181)(58,693)(101,525)
CASH FLOWS—FINANCING ACTIVITIES
Borrowings under senior term loan facility 554,265 — —
Repayment of borrowings under senior notes (790,289) — —
Repayment of borrowings (7,648) (111,763) (1,611)
Debt issuance costs paid (33,947)— (23,432)
Net cash used for financing activities (277,619)(111,763)(25,043)
CASH AND CASH EQUIVALENTS
(Decrease) increase during the year (99,416) 97,582 84,245
Beginning balance 421,007 323,425 239,180
Ending balance $ 321,591 $ 421,007 $ 323,425
Supplemental Schedule of Cash Flow Information:
Cash paid (received) during the year for:
Interest $ 195,543 $ 200,676 $ 188,587
Income taxes $ 22,458 $ 15,930 $ (29,639)
Non-cash activities:
Adjustments to goodwill related to pre-acquisition tax contingencies $ — $ — $ (18,049)
See Notes to Consolidated Financial Statements.
F-7