Neiman Marcus 2010 Annual Report Download - page 33
Download and view the complete annual report
Please find page 33 of the 2010 Neiman Marcus annual report below. You can navigate through the pages in the report by either clicking on the pages listed below, or by using the keyword search tool below to find specific information within the annual report.-
 1
1 -
2
-
3
-
4
-
5
-
6
-
7
-
8
-
9
-
10
-
11
-
12
-
13
-
14
-
15
-
16
-
17
-
18
-
19
-
20
-
21
-
22
-
 23
23 -
 24
24 -
 25
25 -
 26
26 -
 27
27 -
 28
28 -
 29
29 -
 30
30 -
 31
31 -
 32
32 -
 33
33 -
 34
34 -
 35
35 -
 36
36 -
 37
37 -
 38
38 -
 39
39 -
 40
40 -
 41
41 -
 42
42 -
 43
43 -
44
-
45
-
46
-
47
-
48
-
49
-
50
-
51
-
52
-
53
-
54
-
55
-
56
-
57
-
58
-
59
-
60
-
61
-
62
-
63
-
64
-
65
-
66
-
67
-
68
-
69
-
70
-
71
-
72
-
73
-
74
-
75
-
76
-
77
-
78
-
79
-
80
-
81
-
82
-
83
-
84
-
85
-
86
-
87
-
88
-
89
-
90
-
91
-
92
-
93
-
94
-
95
-
96
-
97
-
98
-
99
-
100
-
101
-
102
-
103
-
104
-
105
-
106
-
107
-
108
-
109
-
110
-
111
-
112
-
113
-
114
-
115
-
116
-
117
-
118
-
119
-
120
-
121
-
122
-
123
-
124
-
125
-
126
-
127
-
128
-
129
-
130
-
131
-
132
-
133
-
134
-
135
-
136
-
137
-
138
-
139
-
140
-
141
-
142
-
143
-
144
-
145
-
146
-
147
-
148
-
149
-
150
-
151
-
152
-
153
-
154
-
155
-
156
-
157
-
158
-
159
-
160
-
161
-
162
-
163
-
164
-
165
-
166
-
167
-
168
-
169
-
170
-
171
-
172
-
173
-
174
-
175
-
176
-
177
-
178
-
179
-
180
-
181
-
182
-
183
-
184
-
185
 |
 |

Table of Contents
We monitor the sales performance of our inventories throughout each season. We seek to order additional goods to
supplement our original purchasing decisions when the level of customer demand is higher than originally anticipated. However, in
certain merchandise categories, particularly fashion apparel, our ability to purchase additional goods can be limited. This can result in
lost sales in the event of higher than anticipated demand for the fashion goods we offer or a higher than anticipated level of consumer
spending. Conversely, in the event we buy fashion goods that are not accepted by the customer or the level of consumer spending is
less than we anticipated, we typically incur a higher than anticipated level of markdowns, net of vendor allowances, resulting in lower
operating profits. We believe that the experience of our merchandising and selling organizations helps to minimize the inherent risk in
predicting fashion trends.
Fiscal Year Ended July 30, 2011 Compared to Fiscal Year Ended July 31, 2010
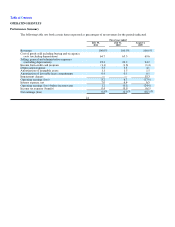
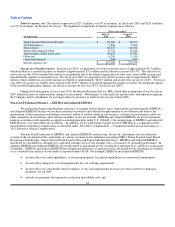
Revenues. Our revenues for fiscal year 2011 of $4,002.3 million increased by $309.5 million, or 8.4%, from $3,692.8
million in fiscal year 2010. The increase in revenues was due to increases in comparable revenues related to a higher level of
customer demand. New stores generated revenues of $9.7 million in fiscal year 2011.
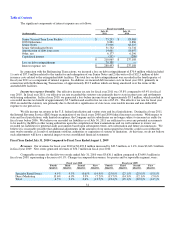
Comparable revenues for the fifty-two weeks ended July 30, 2011 were $3,992.6 million compared to $3,692.8 million in
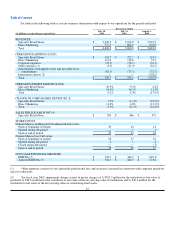
fiscal year 2010, representing an increase of 8.1%. Changes in comparable revenues, by quarter and by reportable segment, were:
Fiscal year 2011 Fiscal year 2010
Fourth
Quarter
Third
Quarter
Second
Quarter
First
Quarter
Fourth
Quarter
Third
Quarter
Second
Quarter
First
Quarter
Specialty Retail Stores 11.0% 8.3% 6.0% 5.1% 4.9% 9.5% (0.6)% (14.9)%
Direct Marketing 11.0% 16.1% 6.3% 12.8% 13.6% 6.9% 5.9% (7.2)%
Total 11.0% 9.7% 6.0% 6.4% 6.5% 9.1% 0.6% (13.7)%
Internet revenues generated by our Direct Marketing operation were $653.7 million for fiscal year 2011, an increase of 13.9%
compared to the prior fiscal year. Catalog revenues decreased 4.3% compared to the prior fiscal year as we reduce our catalog
circulation and our customers continue to migrate toward online retailing.
Cost of goods sold including buying and occupancy costs (excluding depreciation). COGS for fiscal year 2011 was 64.7%
of revenues compared to 65.5% of revenues for fiscal year 2010. The decrease in COGS by 0.8% of revenues for fiscal year 2011 was
primarily due to:
• increased product margins of approximately 0.9% of revenues in our Specialty Retail Stores due to higher levels of full-price
sales and lower net markdowns and promotions costs; and
• the leveraging of buying and occupancy costs by 0.5% of revenues on higher revenues; offset by
• decreased product margins generated by our Direct Marketing operation of approximately 0.6% primarily due to higher net
markdowns in response to lower than anticipated customer demand, particularly during the second quarter of fiscal year
2011, and lower delivery and processing net revenues.
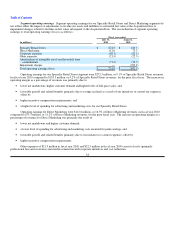
Selling, general and administrative expenses (excluding depreciation). SG&A expenses as a percentage of revenues
decreased to 23.3% of revenues in fiscal year 2011 compared to 24.0% of revenues in the prior fiscal year. The net decrease in SG&A
expenses by 0.7% of revenues in fiscal year 2011 was primarily due to:
• lower spending for professional fees and expenses, primarily costs related to corporate initiatives incurred in fiscal year
2010, of approximately 0.5% of revenues; and
• favorable payroll and related costs of approximately 0.3% of revenues, primarily due to the leveraging of these expenses on
higher revenues and lower benefits costs incurred; offset by
• higher marketing and selling costs of approximately 0.1% of revenues.
29