Neiman Marcus 2010 Annual Report Download - page 132
Download and view the complete annual report
Please find page 132 of the 2010 Neiman Marcus annual report below. You can navigate through the pages in the report by either clicking on the pages listed below, or by using the keyword search tool below to find specific information within the annual report.-
 1
1 -
2
-
3
-
4
-
5
-
6
-
7
-
8
-
9
-
10
-
11
-
12
-
13
-
14
-
15
-
16
-
17
-
18
-
19
-
20
-
21
-
22
-
23
-
24
-
25
-
26
-
27
-
28
-
29
-
30
-
31
-
32
-
33
-
34
-
35
-
36
-
37
-
38
-
39
-
40
-
41
-
42
-
43
-
44
-
45
-
46
-
47
-
48
-
49
-
50
-
51
-
52
-
53
-
54
-
55
-
56
-
57
-
58
-
59
-
60
-
61
-
62
-
63
-
64
-
65
-
66
-
67
-
68
-
69
-
70
-
71
-
72
-
73
-
74
-
75
-
76
-
77
-
78
-
79
-
80
-
81
-
82
-
83
-
84
-
85
-
86
-
87
-
88
-
89
-
90
-
91
-
92
-
93
-
94
-
95
-
96
-
97
-
98
-
99
-
100
-
101
-
102
-
103
-
104
-
105
-
106
-
107
-
108
-
109
-
110
-
111
-
112
-
113
-
114
-
115
-
116
-
117
-
118
-
119
-
120
-
121
-
 122
122 -
 123
123 -
 124
124 -
 125
125 -
 126
126 -
 127
127 -
 128
128 -
 129
129 -
 130
130 -
 131
131 -
 132
132 -
 133
133 -
 134
134 -
 135
135 -
 136
136 -
 137
137 -
 138
138 -
 139
139 -
 140
140 -
 141
141 -
 142
142 -
143
-
144
-
145
-
146
-
147
-
148
-
149
-
150
-
151
-
152
-
153
-
154
-
155
-
156
-
157
-
158
-
159
-
160
-
161
-
162
-
163
-
164
-
165
-
166
-
167
-
168
-
169
-
170
-
171
-
172
-
173
-
174
-
175
-
176
-
177
-
178
-
179
-
180
-
181
-
182
-
183
-
184
-
185
 |
 |
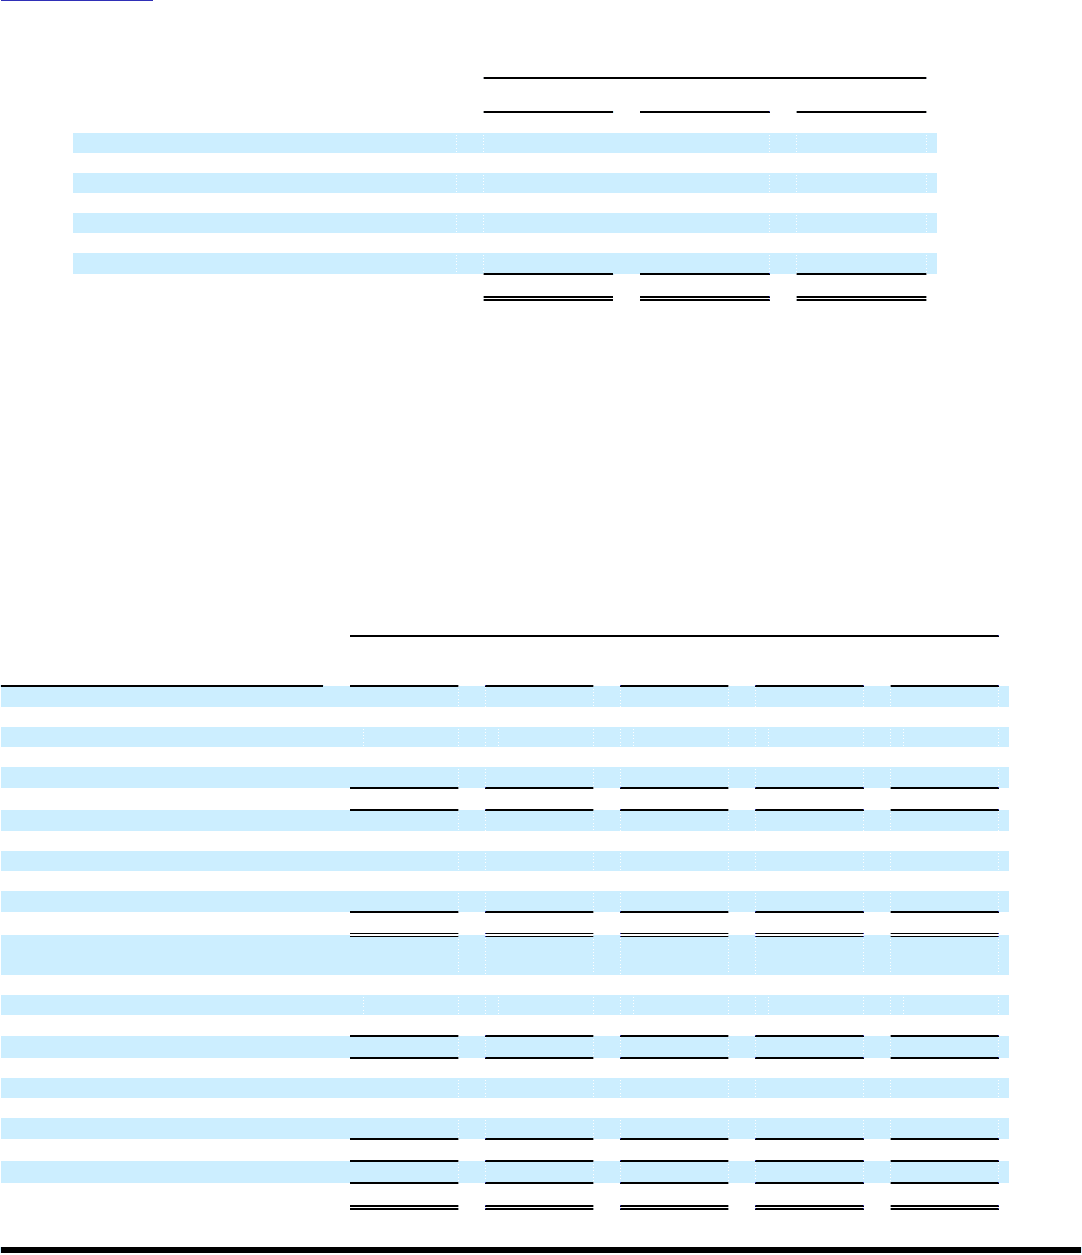
Table of Contents
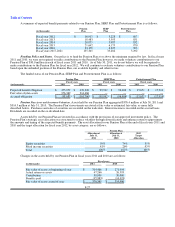
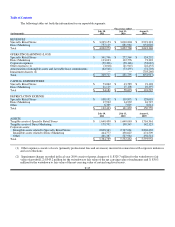
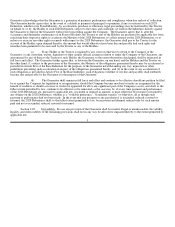
The following table presents our revenues by merchandise category as a percentage of net sales:
Years Ended
July 30,
2011
July 31,
2010
August 1,
2009
Women's Apparel 35% 36% 36%
Women's Shoes, Handbags and Accessories 24% 22% 21%
Men's Apparel and Shoes 12% 11% 12%
Designer and Precious Jewelry 11% 11% 11%
Cosmetics and Fragrances 10% 11% 11%
Home Furnishings and Décor 6% 7% 7%
Other 2%2%2%
100%100%100%
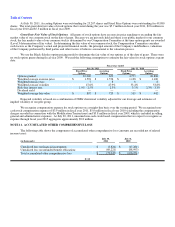
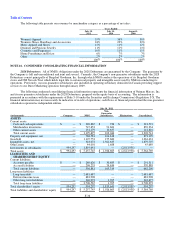
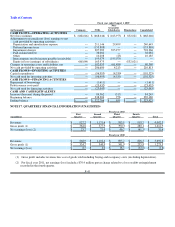
NOTE 16. CONDENSED CONSOLIDATING FINANCIAL INFORMATION
2028 Debentures. All of NMG's obligations under the 2028 Debentures are guaranteed by the Company. The guarantee by
the Company is full and unconditional and joint and several. Currently, the Company's non-guarantor subsidiaries under the 2028
Debentures consist principally of Bergdorf Goodman, Inc. through which NMG conducts the operations of its Bergdorf Goodman
stores and NM Nevada Trust which holds legal title to certain real property and intangible assets used by NMG in conducting its
operations. Previously, our non-guarantor subsidiaries also included an operating subsidiary domiciled in Canada providing support
services to our Direct Marketing operation through January 2009.
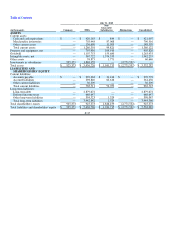
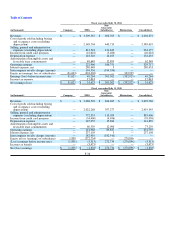
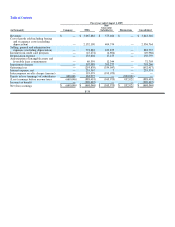
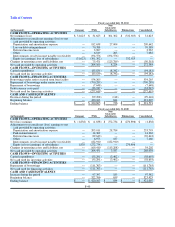
The following condensed consolidating financial information represents the financial information of Neiman Marcus, Inc.
and its non-guarantor subsidiaries under the 2028 Debentures, prepared on the equity basis of accounting. The information is
presented in accordance with the requirements of Rule 3-10 under the Securities and Exchange Commission's Regulation S-X. The
financial information may not necessarily be indicative of results of operations, cash flows or financial position had the non-guarantor
subsidiaries operated as independent entities.
July 30, 2011
(in thousands) Company NMG
Non-
Guarantor
Subsidiaries Eliminations Consolidated
ASSETS
Current assets:
Cash and cash equivalents $ — $ 320,865 $ 726 $ — $ 321,591
Merchandise inventories — 747,653 91,681 — 839,334
Other current assets — 131,179 10,637 — 141,816
Total current assets — 1,199,697 103,044 — 1,302,741
Property and equipment, net — 768,581 104,618 — 873,199
Goodwill — 1,107,753 155,680 — 1,263,433
Intangible assets, net — 318,072 1,561,635 — 1,879,707
Other assets — 44,001 1,688 — 45,689
Investments in subsidiaries 994,297 1,819,641 — (2,813,938)—
Total assets $ 994,297 $ 5,257,745 $ 1,926,665 $ (2,813,938) $ 5,364,769
LIABILITIES AND
SHAREHOLDERS' EQUITY
Current liabilities:
Accounts payable $ — $ 260,626 $ 30,685 $ — $ 291,311
Accrued liabilities — 296,255 74,634 — 370,889
Total current liabilities — 556,881 105,319 — 662,200
Long-term liabilities:
Long-term debt — 2,681,687 — — 2,681,687
Deferred income taxes — 683,908 — — 683,908
Other long-term liabilities — 340,972 1,705 — 342,677
Total long-term liabilities — 3,706,567 1,705 — 3,708,272
Total shareholders' equity 994,297 994,297 1,819,641 (2,813,938)994,297
Total liabilities and shareholders' equity $ 994,297 $ 5,257,745 $ 1,926,665 $ (2,813,938)$ 5,364,769
F-36