Neiman Marcus 2010 Annual Report Download - page 131
Download and view the complete annual report
Please find page 131 of the 2010 Neiman Marcus annual report below. You can navigate through the pages in the report by either clicking on the pages listed below, or by using the keyword search tool below to find specific information within the annual report.-
 1
1 -
2
-
3
-
4
-
5
-
6
-
7
-
8
-
9
-
10
-
11
-
12
-
13
-
14
-
15
-
16
-
17
-
18
-
19
-
20
-
21
-
22
-
23
-
24
-
25
-
26
-
27
-
28
-
29
-
30
-
31
-
32
-
33
-
34
-
35
-
36
-
37
-
38
-
39
-
40
-
41
-
42
-
43
-
44
-
45
-
46
-
47
-
48
-
49
-
50
-
51
-
52
-
53
-
54
-
55
-
56
-
57
-
58
-
59
-
60
-
61
-
62
-
63
-
64
-
65
-
66
-
67
-
68
-
69
-
70
-
71
-
72
-
73
-
74
-
75
-
76
-
77
-
78
-
79
-
80
-
81
-
82
-
83
-
84
-
85
-
86
-
87
-
88
-
89
-
90
-
91
-
92
-
93
-
94
-
95
-
96
-
97
-
98
-
99
-
100
-
101
-
102
-
103
-
104
-
105
-
106
-
107
-
108
-
109
-
110
-
111
-
112
-
113
-
114
-
115
-
116
-
117
-
118
-
119
-
120
-
 121
121 -
 122
122 -
 123
123 -
 124
124 -
 125
125 -
 126
126 -
 127
127 -
 128
128 -
 129
129 -
 130
130 -
 131
131 -
 132
132 -
 133
133 -
 134
134 -
 135
135 -
 136
136 -
 137
137 -
 138
138 -
 139
139 -
 140
140 -
 141
141 -
142
-
143
-
144
-
145
-
146
-
147
-
148
-
149
-
150
-
151
-
152
-
153
-
154
-
155
-
156
-
157
-
158
-
159
-
160
-
161
-
162
-
163
-
164
-
165
-
166
-
167
-
168
-
169
-
170
-
171
-
172
-
173
-
174
-
175
-
176
-
177
-
178
-
179
-
180
-
181
-
182
-
183
-
184
-
185
 |
 |

Table of Contents
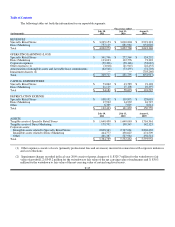
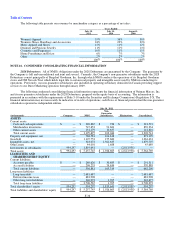
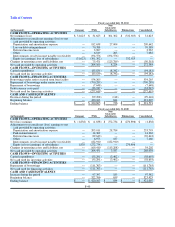
The following tables set forth the information for our reportable segments:
Fiscal year ended
(in thousands)
July 30,
2011
July 31,
2010
August 1,
2009
REVENUES
Specialty Retail Stores $ 3,245,153 $ 3,010,804 $ 2,991,318
Direct Marketing 757,119 681,964 652,028
Total $ 4,002,272 $ 3,692,768 $ 3,643,346
OPERATING EARNINGS (LOSS)
Specialty Retail Stores $ 341,746 $ 272,569 $ 124,252
Direct Marketing 113,033 112,576 73,322
Corporate expenses (59,496) (58,146) (52,067)
Other expenses (1) (3,018) (21,945) (22,455)
Amortization of intangible assets and favorable lease commitments (62,548) (73,259) (72,703)
Impairment charges (2) — — (703,266)
Total $ 329,717 $ 231,795 $ (652,917)
CAPITAL EXPENDITURES
Specialty Retail Stores $ 73,062 $ 43,585 $ 91,128
Direct Marketing 21,119 15,108 10,397
Total $ 94,181 $ 58,693 $ 101,525
DEPRECIATION EXPENSE
Specialty Retail Stores $ 108,192 $ 119,871 $ 128,018
Direct Marketing 17,932 14,939 16,727
Other 6,309 7,029 6,014
Total $ 132,433 $ 141,839 $ 150,759
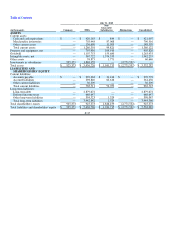
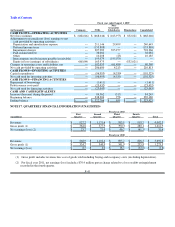
July 30,
2011
July 31,
2010
August 1,
2009
ASSETS
Tangible assets of Specialty Retail Stores $ 1,640,450 $ 1,640,063 $ 1,716,361
Tangible assets of Direct Marketing 179,792 158,547 142,123
Corporate assets:
Intangible assets related to Specialty Retail Stores 2,698,363 2,747,061 2,804,438
Intangible assets related to Direct Marketing 444,777 458,627 474,509
Other 401,387 527,984 456,521
Total $ 5,364,769 $ 5,532,282 $ 5,593,952
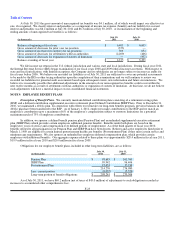
(1) Other expenses consists of costs (primarily professional fees and severance) incurred in connection with corporate initiatives
and cost reductions.
(2) Impairment charges recorded in fiscal year 2009 consist of pretax charges of 1) $329.7 million for the writedown to fair
value of goodwill, 2) $343.2 million for the writedown to fair value of the net carrying value of tradenames and 3) $30.3
million for the writedown to fair value of the net carrying value of certain long-lived assets.
F-35