Neiman Marcus 2010 Annual Report Download - page 26
Download and view the complete annual report
Please find page 26 of the 2010 Neiman Marcus annual report below. You can navigate through the pages in the report by either clicking on the pages listed below, or by using the keyword search tool below to find specific information within the annual report.-
 1
1 -
2
-
3
-
4
-
5
-
6
-
7
-
8
-
9
-
10
-
11
-
12
-
13
-
14
-
15
-
 16
16 -
 17
17 -
 18
18 -
 19
19 -
 20
20 -
 21
21 -
 22
22 -
 23
23 -
 24
24 -
 25
25 -
 26
26 -
 27
27 -
 28
28 -
 29
29 -
 30
30 -
 31
31 -
 32
32 -
 33
33 -
 34
34 -
 35
35 -
 36
36 -
37
-
38
-
39
-
40
-
41
-
42
-
43
-
44
-
45
-
46
-
47
-
48
-
49
-
50
-
51
-
52
-
53
-
54
-
55
-
56
-
57
-
58
-
59
-
60
-
61
-
62
-
63
-
64
-
65
-
66
-
67
-
68
-
69
-
70
-
71
-
72
-
73
-
74
-
75
-
76
-
77
-
78
-
79
-
80
-
81
-
82
-
83
-
84
-
85
-
86
-
87
-
88
-
89
-
90
-
91
-
92
-
93
-
94
-
95
-
96
-
97
-
98
-
99
-
100
-
101
-
102
-
103
-
104
-
105
-
106
-
107
-
108
-
109
-
110
-
111
-
112
-
113
-
114
-
115
-
116
-
117
-
118
-
119
-
120
-
121
-
122
-
123
-
124
-
125
-
126
-
127
-
128
-
129
-
130
-
131
-
132
-
133
-
134
-
135
-
136
-
137
-
138
-
139
-
140
-
141
-
142
-
143
-
144
-
145
-
146
-
147
-
148
-
149
-
150
-
151
-
152
-
153
-
154
-
155
-
156
-
157
-
158
-
159
-
160
-
161
-
162
-
163
-
164
-
165
-
166
-
167
-
168
-
169
-
170
-
171
-
172
-
173
-
174
-
175
-
176
-
177
-
178
-
179
-
180
-
181
-
182
-
183
-
184
-
185
 |
 |

Table of Contents
ITEM 7. MANAGEMENT'S DISCUSSION AND ANALYSIS OF FINANCIAL CONDITION AND RESULTS OF
OPERATIONS
EXECUTIVE OVERVIEW
The following discussion and analysis of our financial condition and results of operations should be read together with our
audited consolidated financial statements and related notes. Unless otherwise specified, the meanings of all defined terms in
Management's Discussion and Analysis of Financial Condition and Results of Operations (MD&A) are consistent with the meanings
of such terms as defined in the Notes to Consolidated Financial Statements. This discussion contains forward-looking statements.
Please see "Forward-Looking Statements" for a discussion of the risks, uncertainties and assumptions relating to these statements.
Overview
The Company is a luxury retailer conducting integrated store and direct-to-consumer operations principally under the Neiman
Marcus and Bergdorf Goodman brand names. We report our store operations as our Specialty Retail Stores segment and our direct-to-
consumer operations as our Direct Marketing segment.
The Company is a subsidiary of Newton Holding, LLC (Holding), which is controlled by investment funds affiliated with
TPG Capital (formerly Texas Pacific Group) and Warburg Pincus LLC (collectively, the Sponsors). The Company's operations are
conducted through its wholly-owned subsidiary, The Neiman Marcus Group, Inc. (NMG). The Sponsors acquired NMG in a
leveraged transaction in October 2005 (the Acquisition).
Our fiscal year ends on the Saturday closest to July 31. Like many other retailers, we follow a 4-5-4 reporting calendar. All
references to fiscal year 2011 relate to the fifty-two weeks ended July 30, 2011, all references to fiscal year 2010 relate to the fifty-two
weeks ended July 31, 2010 and all references to fiscal year 2009 relate to the fifty-two weeks ended August 1, 2009.
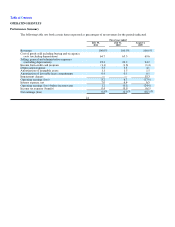
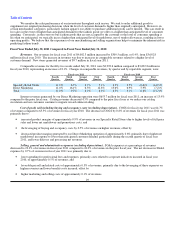
Fiscal Year 2011 Summary
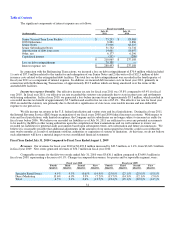
A summary of our operating results is as follows:
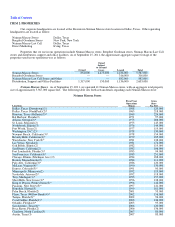
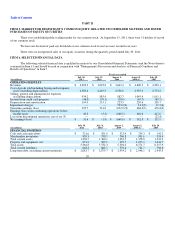
• Revenues—Our revenues for fiscal year 2011 were positively impacted by a higher level of customer demand. As a
result, our revenues for fiscal year 2011 were $4,002.3 million, an increase of 8.4% as compared to fiscal year 2010.
Comparable revenues by quarter for fiscal year 2011 are as follows:
First fiscal quarter 6.4%
Second fiscal quarter 6.0%
Third fiscal quarter 9.7%
Fourth fiscal quarter 11.0%
For Specialty Retail Stores, our sales per square foot increased to $505 for the fifty-two weeks ended July 30, 2011 from
$466 for the fifty-two weeks ended July 31, 2010.
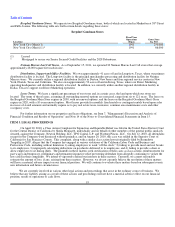
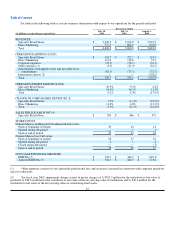
• Cost of goods sold including buying and occupancy costs (excluding depreciation) (COGS)—COGS represented
64.7% of revenues in fiscal year 2011, an improvement of 0.8% of revenues compared to fiscal year 2010. This
decrease in COGS, as a percentage of revenues, was primarily due to 1) higher levels of full-price sales, 2) lower net
markdowns and promotions costs in our Specialty Retail Stores and 3) the leveraging of buying and occupancy costs on
higher revenues.
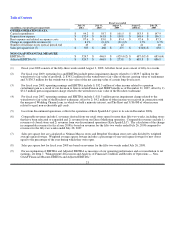
• Inventories—During fiscal year 2011, we continued to closely manage our inventories. At July 30, 2011, on-hand
inventories totaled $839.3 million, a 6.2% increase from the prior year fiscal period.
• Selling, general and administrative expenses (excluding depreciation) (SG&A)—SG&A represented 23.3% of
revenues in fiscal 2011, a net improvement of 0.7% of revenues compared to fiscal year 2010. The lower levels of
SG&A expenses, as a percentage of revenues, primarily reflect 1) the leveraging of payroll and related benefits costs
and 2) a lower level of aggregate spending on professional fees and corporate initiatives, offset by 3) higher marketing
and selling costs.
22