Neiman Marcus 2010 Annual Report Download - page 137
Download and view the complete annual report
Please find page 137 of the 2010 Neiman Marcus annual report below. You can navigate through the pages in the report by either clicking on the pages listed below, or by using the keyword search tool below to find specific information within the annual report.-
 1
1 -
2
-
3
-
4
-
5
-
6
-
7
-
8
-
9
-
10
-
11
-
12
-
13
-
14
-
15
-
16
-
17
-
18
-
19
-
20
-
21
-
22
-
23
-
24
-
25
-
26
-
27
-
28
-
29
-
30
-
31
-
32
-
33
-
34
-
35
-
36
-
37
-
38
-
39
-
40
-
41
-
42
-
43
-
44
-
45
-
46
-
47
-
48
-
49
-
50
-
51
-
52
-
53
-
54
-
55
-
56
-
57
-
58
-
59
-
60
-
61
-
62
-
63
-
64
-
65
-
66
-
67
-
68
-
69
-
70
-
71
-
72
-
73
-
74
-
75
-
76
-
77
-
78
-
79
-
80
-
81
-
82
-
83
-
84
-
85
-
86
-
87
-
88
-
89
-
90
-
91
-
92
-
93
-
94
-
95
-
96
-
97
-
98
-
99
-
100
-
101
-
102
-
103
-
104
-
105
-
106
-
107
-
108
-
109
-
110
-
111
-
112
-
113
-
114
-
115
-
116
-
117
-
118
-
119
-
120
-
121
-
122
-
123
-
124
-
125
-
126
-
 127
127 -
 128
128 -
 129
129 -
 130
130 -
 131
131 -
 132
132 -
 133
133 -
 134
134 -
 135
135 -
 136
136 -
 137
137 -
 138
138 -
 139
139 -
 140
140 -
 141
141 -
 142
142 -
 143
143 -
 144
144 -
 145
145 -
 146
146 -
 147
147 -
148
-
149
-
150
-
151
-
152
-
153
-
154
-
155
-
156
-
157
-
158
-
159
-
160
-
161
-
162
-
163
-
164
-
165
-
166
-
167
-
168
-
169
-
170
-
171
-
172
-
173
-
174
-
175
-
176
-
177
-
178
-
179
-
180
-
181
-
182
-
183
-
184
-
185
 |
 |
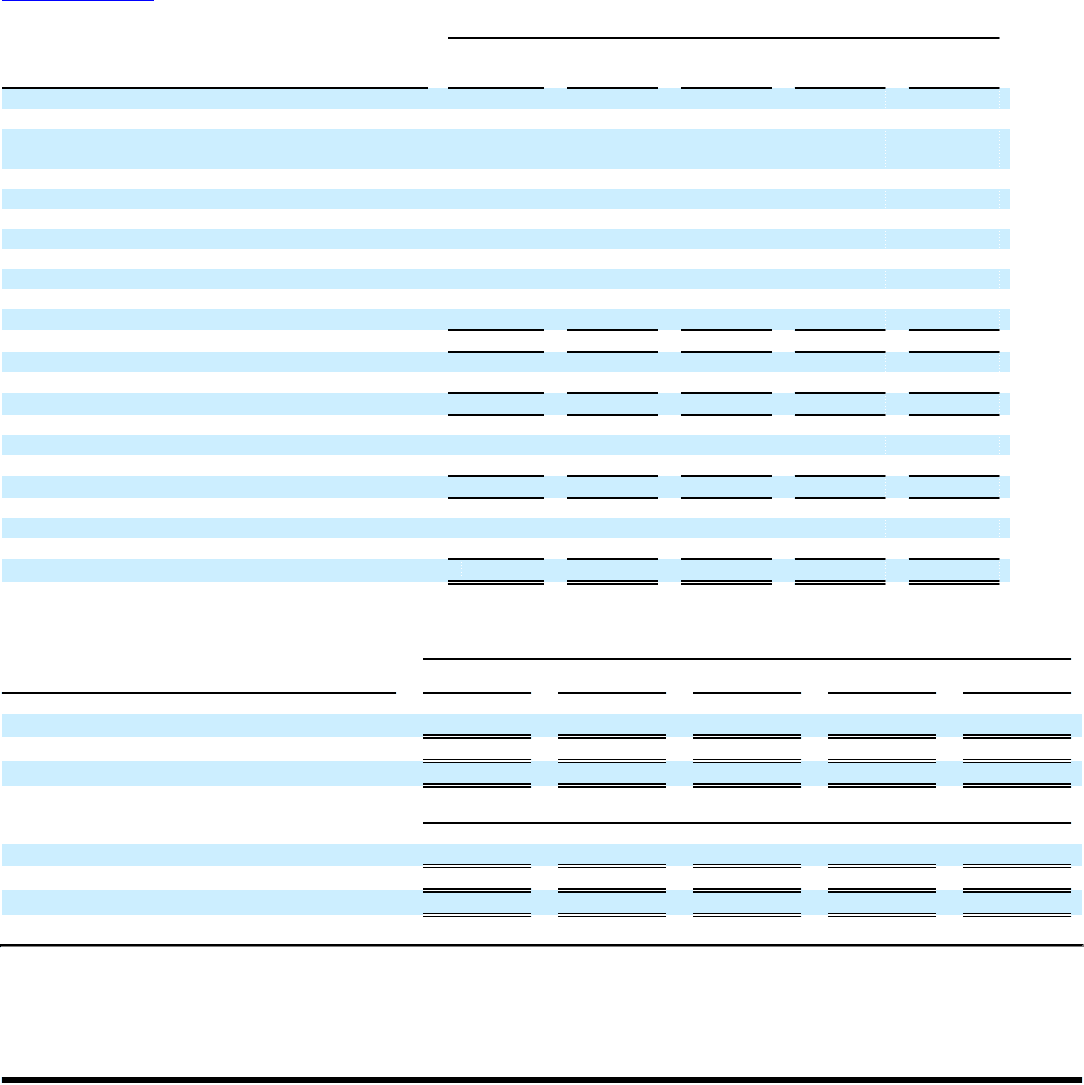
Table of Contents
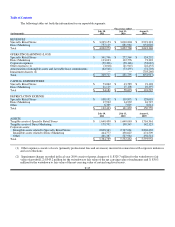
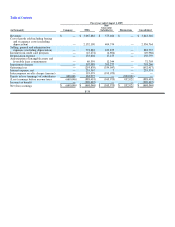
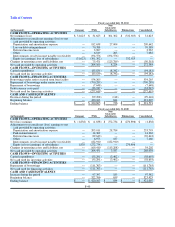
Fiscal year ended August 1, 2009
(in thousands) Company NMG
Non-
Guarantor
Subsidiaries Eliminations Consolidated
CASH FLOWS—OPERATING ACTIVITIES
Net (loss) earnings $ (668,046) $ (668,046) $ (163,975) $ 832,021 $ (668,046)
Adjustments to reconcile net (loss) earnings to net
cash provided by operating activities:
Depreciation and amortization expense — 211,146 29,499 — 240,645
Deferred income taxes — (153,888) — — (153,888)
Impairment charges — 307,989 395,277 — 703,266
Paid-in-kind interest — 38,082 — — 38,082
Other — 10,208 (23) — 10,185
Intercompany royalty income payable (receivable) — 195,079 (195,079) — —
Equity in loss (earnings) of subsidiaries 668,046 163,975 — (832,021) —
Changes in operating assets and liabilities, net — 102,055 (61,486)— 40,569
Net cash provided by operating activities — 206,600 4,213 — 210,813
CASH FLOWS—INVESTING ACTIVITIES
Capital expenditures — (96,995)(4,530)— (101,525)
Net cash used for investing activities — (96,995)(4,530)— (101,525)
CASH FLOWS—FINANCING ACTIVITIES
Repayment of borrowings — (1,611) — — (1,611)
Debt issuance costs paid — (23,432)— — (23,432)
Net cash used for financing activities — (25,043)— — (25,043)
CASH AND CASH EQUIVALENTS
Increase (decrease) during the period — 84,562 (317) — 84,245
Beginning balance — 238,204 976 — 239,180
Ending balance $ — $ 322,766 $ 659 $ — $ 323,425
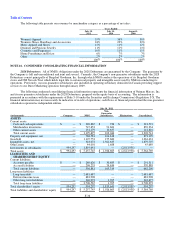
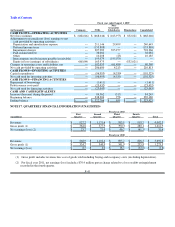
NOTE 17. QUARTERLY FINANCIAL INFORMATION (UNAUDITED)
Fiscal year 2011
(in millions)
First
Quarter
Second
Quarter
Third
Quarter
Fourth
Quarter Total
Revenues $ 927.2 $ 1,171.6 $ 983.8 $ 919.7 $ 4,002.3
Gross profit (1) $ 364.6 $ 377.9 $ 390.3 $ 280.1 $ 1,412.9
Net earnings (loss) (2) $ 25.7 $ 21.0 $ 46.2 $ (61.3)$ 31.6
Fiscal year 2010
Revenues $ 868.9 $ 1,102.4 $ 895.2 $ 826.3 $ 3,692.8
Gross profit (1) $ 334.7 $ 340.9 $ 341.9 $ 255.8 $ 1,273.3
Net earnings (loss) $ 8.5 $ 4.0 $ 18.5 $ (32.8)$ (1.8)
(1) Gross profit includes revenues less cost of goods sold including buying and occupancy costs (excluding depreciation).
(2) For fiscal year 2011, net earnings (loss) include a $70.4 million pretax charge related to a loss on debt extinguishment
recorded in the fourth quarter.
F-41