Neiman Marcus 2010 Annual Report Download - page 125
Download and view the complete annual report
Please find page 125 of the 2010 Neiman Marcus annual report below. You can navigate through the pages in the report by either clicking on the pages listed below, or by using the keyword search tool below to find specific information within the annual report.-
 1
1 -
2
-
3
-
4
-
5
-
6
-
7
-
8
-
9
-
10
-
11
-
12
-
13
-
14
-
15
-
16
-
17
-
18
-
19
-
20
-
21
-
22
-
23
-
24
-
25
-
26
-
27
-
28
-
29
-
30
-
31
-
32
-
33
-
34
-
35
-
36
-
37
-
38
-
39
-
40
-
41
-
42
-
43
-
44
-
45
-
46
-
47
-
48
-
49
-
50
-
51
-
52
-
53
-
54
-
55
-
56
-
57
-
58
-
59
-
60
-
61
-
62
-
63
-
64
-
65
-
66
-
67
-
68
-
69
-
70
-
71
-
72
-
73
-
74
-
75
-
76
-
77
-
78
-
79
-
80
-
81
-
82
-
83
-
84
-
85
-
86
-
87
-
88
-
89
-
90
-
91
-
92
-
93
-
94
-
95
-
96
-
97
-
98
-
99
-
100
-
101
-
102
-
103
-
104
-
105
-
106
-
107
-
108
-
109
-
110
-
111
-
112
-
113
-
114
-
 115
115 -
 116
116 -
 117
117 -
 118
118 -
 119
119 -
 120
120 -
 121
121 -
 122
122 -
 123
123 -
 124
124 -
 125
125 -
 126
126 -
 127
127 -
 128
128 -
 129
129 -
 130
130 -
 131
131 -
 132
132 -
 133
133 -
 134
134 -
 135
135 -
136
-
137
-
138
-
139
-
140
-
141
-
142
-
143
-
144
-
145
-
146
-
147
-
148
-
149
-
150
-
151
-
152
-
153
-
154
-
155
-
156
-
157
-
158
-
159
-
160
-
161
-
162
-
163
-
164
-
165
-
166
-
167
-
168
-
169
-
170
-
171
-
172
-
173
-
174
-
175
-
176
-
177
-
178
-
179
-
180
-
181
-
182
-
183
-
184
-
185
 |
 |

Table of Contents
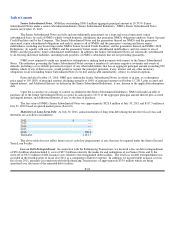
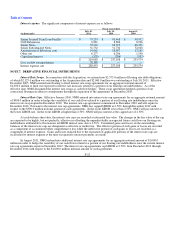
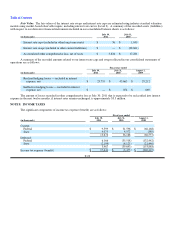
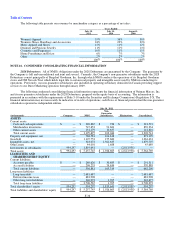
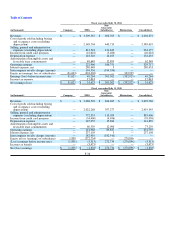
The following tables sets forth by level, within the fair value hierarchy, the Pension Plan's assets at fair value as of July 30,
2011 and July 31, 2010.
Fiscal year 2011
(in thousands) Level 1 Level 2 Level 3 Total
Cash and cash equivalents $ 816 $ — $ — $ 816
Equity securities:
Corporate stock 6,068 — — 6,068
Mutual funds 11,284 — — 11,284
Common/collective trusts — 39,698 — 39,698
Hedge funds — — 141,810 141,810
Limited partnership interests — — 21,409 21,409
Fixed income securities:
Corporate debt securities — 33,951 — 33,951
Mutual funds 110,795 — — 110,795
U.S. government securities 7,038 — — 7,038
Other — 3,500 — 3,500
Total investments $ 136,001 $ 77,149 $ 163,219 $ 376,369
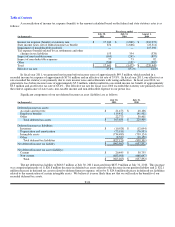
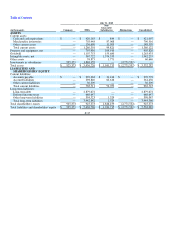
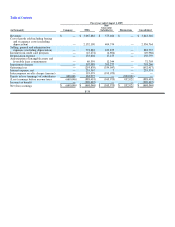
Fiscal year 2010
(in thousands) Level 1 Level 2 Level 3 Total
Equity securities:
Corporate stock $ 20,114 $ — $ — $ 20,114
Mutual funds 42,694 — — 42,694
Common/collective trusts — 44,686 — 44,686
Hedge funds — — 108,785 108,785
Limited partnership interests — — 15,359 15,359
Fixed income securities:
Corporate debt securities — 30,930 — 30,930
Mutual funds 40,245 — — 40,245
U.S. government securities 6,481 1,598 — 8,079
Other — 3,574 — 3,574
Total investments $ 109,534 $ 80,788 $ 124,144 $ 314,466
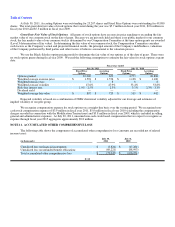
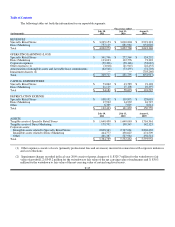
The table below sets forth a summary of changes in the fair value of our Pension Plan's Level 3 investment assets for the
fiscal years 2011 and 2010.
Fiscal years
(in thousands) 2011 2010
Balance, beginning of year $ 124,144 $ 87,448
Purchases 40,367 35,946
Sales (21,590) (6,610)
Realized gains 201 239
Unrealized gains relating to investments still held 20,097 7,121
Balance, end of year $ 163,219 $ 124,144
F-29