National Grid 2010 Annual Report Download - page 72
Download and view the complete annual report
Please find page 72 of the 2010 National Grid annual report below. You can navigate through the pages in the report by either clicking on the pages listed below, or by using the keyword search tool below to find specific information within the annual report.-
 1
1 -
2
-
3
-
4
-
5
-
6
-
7
-
8
-
9
-
10
-
11
-
12
-
13
-
14
-
15
-
16
-
17
-
18
-
19
-
20
-
21
-
22
-
23
-
24
-
25
-
26
-
27
-
28
-
29
-
30
-
31
-
32
-
33
-
34
-
35
-
36
-
37
-
38
-
39
-
40
-
41
-
42
-
43
-
44
-
45
-
46
-
47
-
48
-
49
-
50
-
51
-
52
-
53
-
54
-
55
-
56
-
57
-
58
-
59
-
60
-
61
-
 62
62 -
 63
63 -
 64
64 -
 65
65 -
 66
66 -
 67
67 -
 68
68 -
 69
69 -
 70
70 -
 71
71 -
 72
72 -
 73
73 -
 74
74 -
 75
75 -
 76
76 -
 77
77 -
 78
78 -
 79
79 -
 80
80 -
 81
81 -
 82
82 -
83
-
84
-
85
-
86
-
87
 |
 |

70 National Grid Gas plc Annual Report and Accounts 2009/10
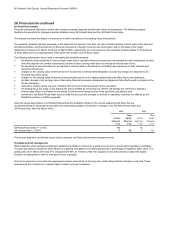
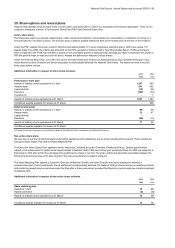
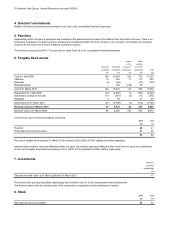
29. Share options and reward plans continued
Share options
Sharesave Executive Plan Total
scheme options options options
Weighted Weighted
average average
price price
£ millions £ millions millions
A
t 31 March 2008 4.85 10.3 4.51 0.1 10.4
Granted 4.88 4.1 - - 4.1
Lapsed - expired 5.97 (1.1) - - (1.1)
Exercised 3.84 (1.3) - - (1.3)
Transfers (i) -----
A
t 31 March 2009 4.86 12.0 4.57 0.1 12.1
Granted 5.20 2.4 - - 2.4
Lapsed - expired 5.41 (0.6) - - (0.6)
Exercised 3.96 (2.4) - - (2.4)
At 31 March 2010 5.10 11.4 4.59 0.1 11.5
Included within options outstanding at 31 March 2010 and 31 March 2009 were the following options which were exercisable:
At 31 March 2010 5.15 0.5 4.41 0.1 0.6
A
t 31 March 2009 4.85 0.1 4.40 0.1 0.2
(i) Transfers arise from employees moving between National Grid Gas and other companies in the National Grid group.
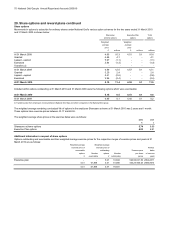
The weighted average share prices at the exercise dates were as follows:
2010 2009
£ £
Sharesave scheme options 5.74 6.99
Executive Plan options 6.03 6.81
Additional information in respect of share options
Weighted average Weighted average
exercise price of exercise price of Normal
exercisable outstanding Exercise price dates
options Number options Number per share of exercise
£ exercisable £ outstanding pence years
Executive plan - -
5.27 16,693 526.00-531.50 2004-2011
4.41 61,858 4.41 61,858 434.25-460.25 2000-2013
4.41 61,858 4.57 78,551
Options outstanding and exercisable and their weighted average exercise prices for the respective ranges of exercise prices and years at 31
March 2010 are as follows:
Movements in options to subscribe for ordinary shares under National Grid's various option schemes for the two years ended 31 March 2010
and 31 March 2009 is shown below:
The weighted average remaining contractual life of options in the employee Sharesave scheme at 31 March 2010 was 2 years and 1 month.
These options have exercise prices between £3.17 and £6.55.