National Grid 2010 Annual Report Download - page 20
Download and view the complete annual report
Please find page 20 of the 2010 National Grid annual report below. You can navigate through the pages in the report by either clicking on the pages listed below, or by using the keyword search tool below to find specific information within the annual report.-
 1
1 -
2
-
3
-
4
-
5
-
6
-
7
-
8
-
9
-
 10
10 -
 11
11 -
 12
12 -
 13
13 -
 14
14 -
 15
15 -
 16
16 -
 17
17 -
 18
18 -
 19
19 -
 20
20 -
 21
21 -
 22
22 -
 23
23 -
 24
24 -
 25
25 -
 26
26 -
 27
27 -
 28
28 -
 29
29 -
 30
30 -
31
-
32
-
33
-
34
-
35
-
36
-
37
-
38
-
39
-
40
-
41
-
42
-
43
-
44
-
45
-
46
-
47
-
48
-
49
-
50
-
51
-
52
-
53
-
54
-
55
-
56
-
57
-
58
-
59
-
60
-
61
-
62
-
63
-
64
-
65
-
66
-
67
-
68
-
69
-
70
-
71
-
72
-
73
-
74
-
75
-
76
-
77
-
78
-
79
-
80
-
81
-
82
-
83
-
84
-
85
-
86
-
87
 |
 |

18 National Grid Gas plc Annual Report and Accounts 2009/10
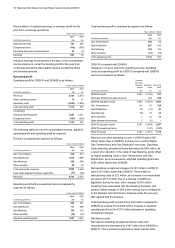
2009/10 compared with 2008/09, while operating profit after
exceptional items increased by £294 million.
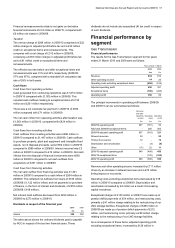
Gas Distribution
Financial performance
The results for the Gas Distribution segment for the years
ended 31 March 2010 and 2009 were as follows:
Years ended 31 March
2010 2009
Continuing operations £m £m
Revenue 1,516 1,466
Other operating income -2
Operating costs excluding exceptional items (805) (800)
Adjusted operating profit 711 668
Exceptional items (44) (58)
Total operating profit 667 610
The principal movements in operating profit between 2008/09
and 2009/10 can be summarised as follows:
Revenue
and othe
r
operating
income
Operating
costs
Operating
profit
Continuing operations £m £m £m
2008/09 operating profit 1,468 (858) 610
Add back 2008/09 exceptional items - 58 58
2008/09 adjusted operating profit 1,468 (800) 668
Allowed revenues 85 - 85
Timing of recoveries (28) - (28)
Pass-through costs - 5 5
Non-formula costs (14) 9 (5)
Other revenues and costs 5 (19) (14)
2009/10 adjusted operating profit 1,516 (805) 711
2009/10 exceptional items - (44) (44)
2009/10 operating profit 1,516 (849) 667
Revenue and other operating income increased by £48 million
in 2009/10 compared with 2008/09. Allowed revenue was up
£85 million, driven by the five year price control that came into
effect on 1 April 2008 and incentive gains through the efficient
management of capacity requirements and improved pressure
management. This was partially offset by an estimated £28
million timing impact on recoveries.
The net year-on-year timing impact against allowed revenue
was a reduction of £28 million as in 2009/10 there was a net
surplus of £19 million, comprising the under-recovery of £1
million relating to the previous year and a £20 million under-
recovery for 2009/10, compared with a net gain of £9 million in
2008/09, comprising a £1 million under-recovery in 2008/09
offset by £10 million under-recovery from 2007/08.
Operating costs for 2009/10, excluding exceptional items, were
largely in line with 2008/09. Efficiency savings through strong
operating cost performance, together with other minor items,
were largely offset by higher costs associated with severe
winter weather conditions and higher depreciation charge. Non-
formula costs were £9 million lower reflecting reduced workload.
Exceptional charges of £44 million in 2009/10 included an
increase in the environmental provision of £14 million, reflecting
changes in landfill tax legislation, with the remaining £30 million
made up of restructuring, transformation costs, which include
system related projects costs, and pension deficit charges. This
compared with a £58 million charge in 2008/09.
As a consequence of the above, adjusted operating profit
excluding exceptional items was £43 million higher in 2009/10
than 2008/09, an increase of 6%. Including exceptional items,
operating profit was £57 million higher in 2009/10 than 2008/09,
an increase of 9%.
Gas Metering
Financial performance
The results for the Gas Metering segment for the years ended
31 March 2010 and 2009 were as follows:
Years ended 31 March
2010 2009
£m £m
Revenue 329 340
Operating costs excluding exceptional items (181) (215)
Adjusted operating profit 148 125
Exceptional items (42) (1)
Total operating profit 106 124
The increase in adjusted operating profit is largely due to a
reduction in operating costs.
Other activities
Other activities comprises xoserve, which delivers
transportation transactional services on behalf of all the major
gas network transportation companies in Great Britain,
including our Gas Transmission and Gas Distribution
businesses, and corporate overheads that are not borne by
individual businesses.
Financial results
The results for other activities for the years ended 31 March
2010 and 2009 were as follows:
Years ended 31 March
2010 2009
£m £m
Revenue 45 43
Operating costs excluding exceptional items (57) (66)
Operating loss (12) (23)
Financial position and
financial management
Going concern
Having made enquiries, the Directors consider that NGG and its
subsidiaries have adequate resources to continue in business
for the foreseeable future and that it is therefore appropriate to
adopt the going concern basis in preparing the consolidated
and individual financial statements of NGG. More details on