National Grid 2010 Annual Report Download - page 45
Download and view the complete annual report
Please find page 45 of the 2010 National Grid annual report below. You can navigate through the pages in the report by either clicking on the pages listed below, or by using the keyword search tool below to find specific information within the annual report.-
 1
1 -
2
-
3
-
4
-
5
-
6
-
7
-
8
-
9
-
10
-
11
-
12
-
13
-
14
-
15
-
16
-
17
-
18
-
19
-
20
-
21
-
22
-
23
-
24
-
25
-
26
-
27
-
28
-
29
-
30
-
31
-
32
-
33
-
34
-
 35
35 -
 36
36 -
 37
37 -
 38
38 -
 39
39 -
 40
40 -
 41
41 -
 42
42 -
 43
43 -
 44
44 -
 45
45 -
 46
46 -
 47
47 -
 48
48 -
 49
49 -
 50
50 -
 51
51 -
 52
52 -
 53
53 -
 54
54 -
 55
55 -
56
-
57
-
58
-
59
-
60
-
61
-
62
-
63
-
64
-
65
-
66
-
67
-
68
-
69
-
70
-
71
-
72
-
73
-
74
-
75
-
76
-
77
-
78
-
79
-
80
-
81
-
82
-
83
-
84
-
85
-
86
-
87
 |
 |

National Grid Gas plc Annual Report and Accounts 2009/10 43
Notes to the consolidated financial statements -
analysis of items in the primary statements
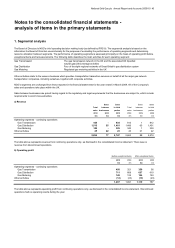
1. Segmental analysis
Gas Transmission The gas transmission network in the UK and the associated UK liquefied
natural gas (LNG) storage activities
Gas Distribution Four of the eight regional networks of Great Britain's gas distribution system
Gas Metering Regulated gas metering activities in the UK
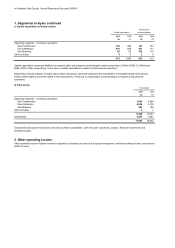
a) Revenue
Sales Sales Sales Sales
Total between to third Total between to third
sales businesses parties sales businesses parties
2010 2010 2010 2009 2009 2009
£m £m £m £m £m £m
Operating segments - continuing operations
Gas Transmission 934 - 934 813 1 812
Gas Distribution 1,516 55 1,461 1,466 65 1,401
Gas Metering 329 - 329 340 1 339
Other activities 45 22 23 43 21 22
2,824 77 2,747 2,662 88 2,574
b) Operating profit
Before exceptional items After exceptional items
2010 2009 2010 2009
£m £m £m £m
Operating segments - continuing operations
Gas Transmission 450 321 350 56
Gas Distribution 711 668 667 610
Gas Metering 148 125 106 124
Other activities (12) (23) (13) (23)
1,297 1,091 1,110 767
NGG's segments are unchanged from those reported in the financial statements for the year ended 31 March 2009. All of the Company's
sales and operations take place within the UK.
Other activities relate to the xoserve business which provides transportation transaction services on behalf of all the major gas network
transportation companies, including ourselves, together with corporate activities.
The table above represents operating profit from continuing operations only, as disclosed in the consolidated income statement. Discontinued
operations had no operating results during the year.
Sales between businesses are priced having regard to the regulatory and legal requirements that the businesses are subject to, which include
requirements to avoid cross-subsidies.
The Board of Directors is NGG's chief operating decision making body (as defined by IFRS 8). The segmental analysis is based on the
information the Board of Directors uses internally for the purposes of evaluating the performance of operating segments and determining
resource allocation between segments. The performance of operating segments is assessed principally on the basis of operating profit before
exceptional items and remeasurements. The following table describes the main activities for each operating segment:
The table above represents revenue from continuing operations only, as disclosed in the consolidated income statement. There was no
revenue from discontinued o
p
erations.