National Grid 2010 Annual Report Download - page 21
Download and view the complete annual report
Please find page 21 of the 2010 National Grid annual report below. You can navigate through the pages in the report by either clicking on the pages listed below, or by using the keyword search tool below to find specific information within the annual report.-
 1
1 -
2
-
3
-
4
-
5
-
6
-
7
-
8
-
9
-
10
-
 11
11 -
 12
12 -
 13
13 -
 14
14 -
 15
15 -
 16
16 -
 17
17 -
 18
18 -
 19
19 -
 20
20 -
 21
21 -
 22
22 -
 23
23 -
 24
24 -
 25
25 -
 26
26 -
 27
27 -
 28
28 -
 29
29 -
 30
30 -
 31
31 -
32
-
33
-
34
-
35
-
36
-
37
-
38
-
39
-
40
-
41
-
42
-
43
-
44
-
45
-
46
-
47
-
48
-
49
-
50
-
51
-
52
-
53
-
54
-
55
-
56
-
57
-
58
-
59
-
60
-
61
-
62
-
63
-
64
-
65
-
66
-
67
-
68
-
69
-
70
-
71
-
72
-
73
-
74
-
75
-
76
-
77
-
78
-
79
-
80
-
81
-
82
-
83
-
84
-
85
-
86
-
87
 |
 |

National Grid Gas plc Annual Report and Accounts 2009/10 19
NGG’s liquidity position are provided under the heading
Liquidity and treasury management below and in note 28 to the
consolidated financial statements.
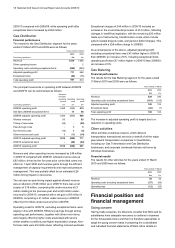
Financial position
Balance sheet
The balance sheet at 31 March 2010 can be summarised as
follows:
Assets Liabilities
Net
assets
£m £m £m
Property, plant and equipment
and non-current intangible assets 10,939 - 10,939
Current assets and liabilities 331 (887) (556)
Other non-current assets and liabilities 5,611 (1,214) 4,397
Deferred tax - (1,890) (1,890)
Total before net debt 16,881 (3,991) 12,890
Net debt 964 (7,823) (6,859)
Total as at 31 March 2010 17,845 (11,814) 6,031
Total as at 31 March 2009 18,432 (12,662) 5,770
The £261 million increase in net assets from £5,770 million at
31 March 2009 to £6,031 million at 31 March 2010 resulted
from the profit for the year from continuing operations of £601
million, net losses recognised directly in equity of £48 million,
other movements in equity of £8 million and dividends paid of
£300 million.
Net debt
Net debt decreased by £21 million from £6,880 million at 31
March 2009 to £6,859 million at 31 March 2010. Cash flows
from operations net of tax of £1,563 million were offset by
capital expenditure, net of disposals, of £952 million, dividends
paid of £300 million and net interest paid of £273 million,
together with fair value and other movements of £17 million.
At 31 March 2010, net debt comprised borrowings of £7,672
million including bank overdrafts of £15 million, less derivative
financial instruments with a net carrying value of £486 million,
cash and cash equivalents of £1 million, and financial
investments of £326 million (31 March 2009: borrowings of
£8,672 million including bank overdrafts of £10 million less
derivative financial instruments with a net carrying value of
£783 million, and financial investments of £1,009 million).
The maturity of borrowings is shown in note 17 to the
consolidated financial statements.
Capital structure
We monitor the regulatory asset value (RAV) gearing within the
Gas Transmission and Gas Distribution businesses. This is
calculated as net debt expressed as a percentage of RAV, and
indicates the level of debt employed to fund the regulated
businesses. It is compared with the level of RAV gearing
indicated by Ofgem as being appropriate for these businesses,
at around 60%.
To calculate RAV gearing for the regulated Gas Transmission
and Gas Distribution businesses we exclude an element of the
debt that is associated with the Gas Metering business. RAV
gearing as at 31 March 2010 was 57% compared to 60% as at
31 March 2009.
Liquidity and treasury management
Treasury policy
Funding and treasury risk management for NGG is carried out
by the treasury function of National Grid under policies and
guidelines approved by the Finance Committees of the Boards
of National Grid plc and National Grid Gas plc. The Finance
Committees have authority delegated from the relevant Boards
and are responsible for regular review and monitoring of
treasury activity and for the approval of specific transactions,
the authority for which may be further delegated.
The primary objective of the treasury function is to manage the
funding and liquidity requirements of National Grid. A secondary
objective is to manage the associated financial risks, in the form
of interest rate risk and foreign exchange risk, to within
acceptable boundaries. Further details of the management of
funding and liquidity and the main risks arising from our
financing activities are set out below, as are the policies for
managing these risks, including the use of financial derivatives,
which are agreed and reviewed by the Boards and the Finance
Committees.
The treasury function is not operated as a profit centre. Debt
and treasury positions are managed in a non speculative
manner, such that all transactions in financial instruments or
products are matched to an underlying current or anticipated
business requirement.
Commodity derivatives entered into in respect of gas
commodities are used in support of the business’s operational
requirements and their use is explained on page 21.
Current condition of the financial markets
During 2009/10, there has been a partial recovery in the global
economic situation, following the crisis in the banking system,
the failure of individual banks and increased restrictions on
lending across the capital and money markets in 2008/09.
Credit spreads have narrowed significantly. With our low risk
business model and cash flows that are largely stable over a
period of years, we were able to access the markets during
2008/09 and have continued to do so in 2009/10, having issued
£366 million of long-term debt into the capital markets. We
remain confident of our ability to access the public debt markets
in the future. The cost of our new long-term debt has fallen over
the last year, decreasing from around 6.0% in 2008/09 to
around 3.0% in 2009/10. This reflects the increase in credit
spreads demanded by lenders more than offset by the fall in
headline interest rates.
Cash flow and cash flow forecasting
Cash flows from operations are largely stable over a period of
years, although they do depend on the timing of customer
payments. Our gas transmission and distribution operations are
subject to multi-year price control agreements with our
regulator, Ofgem.