National Grid 2010 Annual Report Download - page 19
Download and view the complete annual report
Please find page 19 of the 2010 National Grid annual report below. You can navigate through the pages in the report by either clicking on the pages listed below, or by using the keyword search tool below to find specific information within the annual report.-
 1
1 -
2
-
3
-
4
-
5
-
6
-
7
-
8
-
 9
9 -
 10
10 -
 11
11 -
 12
12 -
 13
13 -
 14
14 -
 15
15 -
 16
16 -
 17
17 -
 18
18 -
 19
19 -
 20
20 -
 21
21 -
 22
22 -
 23
23 -
 24
24 -
 25
25 -
 26
26 -
 27
27 -
 28
28 -
 29
29 -
30
-
31
-
32
-
33
-
34
-
35
-
36
-
37
-
38
-
39
-
40
-
41
-
42
-
43
-
44
-
45
-
46
-
47
-
48
-
49
-
50
-
51
-
52
-
53
-
54
-
55
-
56
-
57
-
58
-
59
-
60
-
61
-
62
-
63
-
64
-
65
-
66
-
67
-
68
-
69
-
70
-
71
-
72
-
73
-
74
-
75
-
76
-
77
-
78
-
79
-
80
-
81
-
82
-
83
-
84
-
85
-
86
-
87
 |
 |

National Grid Gas plc Annual Report and Accounts 2009/10 17
Financial remeasurements relate to net gains on derivative
financial instruments of £33 million in 2009/10, compared with
£6 million net losses in 2008/09.
Taxation
The net tax charge of £288 million in 2009/10 comprised a £322
million charge on adjusted profit before tax and a £34 million
credit on exceptional items and remeasurements. This
compares with a net charge of £312 million in 2008/09,
comprising a £393 million charge on adjusted profit before tax
and a £81 million credit on exceptional items and
remeasurements.
The effective tax rate before and after exceptional items and
remeasurements was 31% and 32% respectively (2008/09:
57% and 87%), compared with a standard UK corporation tax
rate of 28% in both years.
Cash flows
Cash flows from operating activities
Cash generated from continuing operations was £1,872 million
in 2009/10 compared with £1,005 million in 2008/09. This
included cash outflows relating to exceptional items of £123
million and £261 million respectively.
There was a net corporate tax payment in 2009/10 of £309
million compared with £71 million in 2008/09.
The net cash inflow from operating activities after taxation was
£1,563 million in 2009/10, compared with £934 million in
2008/09.
Cash flows from investing activities
Cash outflows from investing activities were £266 million in
2009/10 compared to £1,447 million in 2008/09. Cash outflows
to purchase property, plant and equipment and intangible fixed
assets, net of disposal proceeds, were £952 million in 2009/10
compared to £989 million in 2008/09. Interest received was £3
million in 2009/10 compared to £19 million in 2008/09. Net cash
inflows from the disposal of financial investments were £683
million in 2009/10 compared to net cash outflows from
acquisitions of £491 million in 2008/09.
Cash flows from financing activities
The net cash outflow from financing activities was £1,301
million in 2009/10 compared to a cash inflow of £504 million in
2008/09. This reflected net outflows from loans of £725 million
(2008/09: £1,122 million inflow) and net payments to providers
of finance, in the form of interest and dividends, of £576 million
(2008/09: £618 million).
Net interest cash outflows decreased from £299 million in
2008/09 to £273 million in 2009/10.
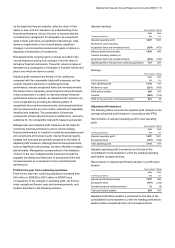
Dividends in respect of the financial year
2010 2009
£m £m
Interim 300 300
The table above shows the ordinary dividends paid or payable
by NGG in respect of the last two financial years. These
dividends do not include any associated UK tax credit in respect
of such dividends.
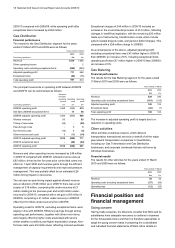
Financial performance by
segment
Gas Transmission
Financial performance
The results for the Gas Transmission segment for the years
ended 31 March 2010 and 2009 were as follows:
Years ended 31 March
2010 2009
£m £m
Revenue 934 812
Other operating income 14 25
Operating costs excluding exceptional items (498) (516)
Adjusted operating profit 450 321
Exceptional items (100) (265)
Operating profit 350 56
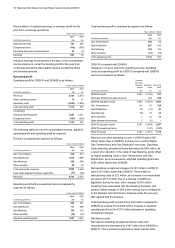
The principal movements in operating profit between 2008/09
and 2009/10 can be summarised as follows:
Revenue
and othe
r
operating
income
Operating
costs
Operating
profit
£m £m £m
2008/09 operating profit 837 (781) 56
Add back 2008/09 exceptional items - 265 265
2008/09 adjusted operating profit 837 (516) 321
Allowed revenues 50 - 50
Timing of recoveries 72 - 72
Depreciation and amortisation - (4) (4)
Other (11) 22 11
2009/10 adjusted operating profit 948 (498) 450
2009/10 exceptional items - (100) (100)
2009/10 operating profit 948 (598) 350
Revenue and other operating income increased by £111 million
driven by an increase in allowed revenues and a £72 million
timing impact on recoveries.
Operating costs excluding exceptional items decreased by £18
million in 2009/10 compared to 2008/09. Depreciation and
amortisation increased by £4 million as a result of increasing
capital investment.
Exceptional charges of £100 million in 2009/10 are made up of
pension deficit payments of £54 million, and restructuring costs,
primarily a £41 million charge relating to the restructuring of our
LNG storage facilities. Exceptional charges of £265 million in
2008/09 are made up of pension deficit payments of £212
million, and restructuring costs, primarily a £50 million charge
relating to the restructuring of our LNG storage facilities.
As a consequence of these items, adjusted operating profit,
excluding exceptional items, increased by £129 million in