National Grid 2010 Annual Report Download - page 17
Download and view the complete annual report
Please find page 17 of the 2010 National Grid annual report below. You can navigate through the pages in the report by either clicking on the pages listed below, or by using the keyword search tool below to find specific information within the annual report.
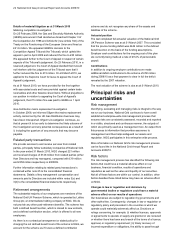
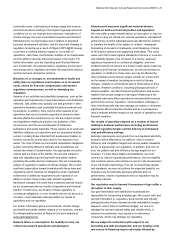
National Grid Gas plc Annual Report and Accounts 2009/10 15
on the basis that they are material, either by virtue of their
nature or size, and are relevant to an understanding of our
financial performance. Items of income or expense that are
considered by management for designation as exceptional
items include such items as significant restructurings, write-
downs or impairments of non-current assets, significant
changes in environmental provisions and gains or losses on
disposals of businesses or investments.
Remeasurements comprise gains or losses recorded in the
income statement arising from changes in the fair value of
derivative financial instruments. These fair values increase or
decrease as a consequence of changes in financial indices and
prices over which we have no control.
Adjusted profit measures are limited in their usefulness
compared with the comparable total profit measures, as they
exclude important elements of underlying financial
performance, namely exceptional items and remeasurements.
We believe that in separately presenting financial performance
in two components it is easier to read and interpret financial
performance between periods, as adjusted profit measures are
more comparable by excluding the distorting effect of
exceptional items and remeasurements, and exceptional items
and remeasurements are more clearly understood if separately
identified and analysed. The presentation of these two
components of financial performance is additional to, and not a
substitute for, the comparable total profit measures presented.
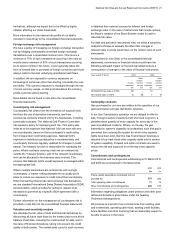
Management uses adjusted profit measures as the basis for
monitoring financial performance and in communicating
financial performance to investors in external presentations and
announcements of financial results. Internal financial reports,
budgets and forecasts are primarily prepared on the basis of
adjusted profit measures, although planned exceptional items,
such as significant restructurings, are also reflected in budgets
and forecasts. Management compensates for the limitations
inherent in the use of adjusted profit measures through the
separate monitoring and disclosure of exceptional items and
remeasurements as a component of our overall financial
performance.
Profit for the year from continuing operations
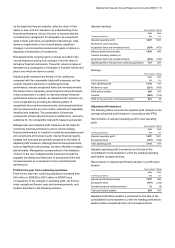
Profit for the year from continuing operations increased from
£48 million in 2008/09 to £601 million in 2009/10 as a
consequence of the changes in operating profit, net finance
costs, exceptional finance costs and remeasurements, and
taxation described in the following sections:
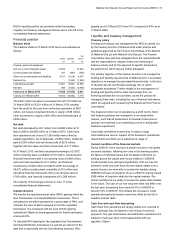
Adjusted earnings
Years ended 31 March
2010 2009
Continuing operations £m £m
Adjusted operating profit 1,297 1,091
Net finance costs excluding
exceptional items and remeasurements (254) (401)
Adjusted profit before taxation 1,043 690
Taxation excluding taxation on
exceptional items and remeasurements (322) (393)
Adjusted profit for the year from continuing operations 721 297
Earnings
Years ended 31 March
2010 2009
Continuing operations £m £m
Total operating profit 1,110 767
Net finance costs (221) (407)
Profit before taxation 889 360
Taxation (288) (312)
Profit for the year from continuing operations 601 48
Adjusted profit measures
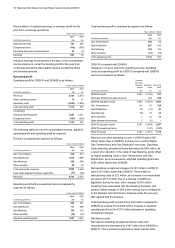
The following tables reconcile the adjusted profit measure to the
corresponding total profit measure in accordance with IFRS.
Reconciliation of adjusted operating profit to total operating
profit
Years ended 31 March
2010 2009
Continuing operations £m £m
Adjusted operating profit 1,297 1,091
Exceptional items (187) (324)
Total operating profit 1,110 767
Adjusted operating profit is presented on the face of the
consolidated income statement, under the heading operating
profit before exceptional items.
Reconciliation of adjusted profit before taxation to profit before
taxation
Years ended 31 March
2010 2009
Continuing operations £m £m
Adjusted profit before taxation 1,043 690
Exceptional items (187) (324)
Derivative financial remeasurements 33 (6)
Total profit before taxation 889 360
Adjusted profit before taxation is presented on the face of the
consolidated income statement, under the heading profit before
taxation before exceptional items and remeasurements.


