National Grid 2010 Annual Report Download - page 14
Download and view the complete annual report
Please find page 14 of the 2010 National Grid annual report below. You can navigate through the pages in the report by either clicking on the pages listed below, or by using the keyword search tool below to find specific information within the annual report.-
 1
1 -
2
-
3
-
 4
4 -
 5
5 -
 6
6 -
 7
7 -
 8
8 -
 9
9 -
 10
10 -
 11
11 -
 12
12 -
 13
13 -
 14
14 -
 15
15 -
 16
16 -
 17
17 -
 18
18 -
 19
19 -
 20
20 -
 21
21 -
 22
22 -
 23
23 -
 24
24 -
25
-
26
-
27
-
28
-
29
-
30
-
31
-
32
-
33
-
34
-
35
-
36
-
37
-
38
-
39
-
40
-
41
-
42
-
43
-
44
-
45
-
46
-
47
-
48
-
49
-
50
-
51
-
52
-
53
-
54
-
55
-
56
-
57
-
58
-
59
-
60
-
61
-
62
-
63
-
64
-
65
-
66
-
67
-
68
-
69
-
70
-
71
-
72
-
73
-
74
-
75
-
76
-
77
-
78
-
79
-
80
-
81
-
82
-
83
-
84
-
85
-
86
-
87
 |
 |

12 National Grid Gas plc Annual Report and Accounts 2009/10
programme of activities within the UK to improve these scores
further.
Gas Metering
Gas Metering has met 17 out of 18 standards of service in
2009/10.
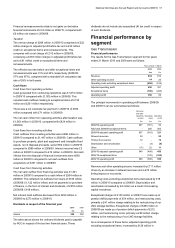
Delivering strong, sustainable regulatory and
long-term contracts with good returns
We will work with Ofgem and the UK government to develop the
changes that are required to address climate change and
security of supply in a way that is affordable for consumers and
ensures timely delivery while also ensuring adequate returns for
our investors.
Significant levels of investment over the next few years mean
that it is vital that we optimise our regulatory returns and ensure
we are appropriately compensated for our investments.
The overall regulatory framework, and the price controls which
form part of this framework, provide the environment that
enables us to be confident that where we act efficiently and
economically and in the consumers’ interest then we will receive
appropriate returns.
We are actively participating in Ofgem’s review of the current
RPI–X based regulatory framework, which is discussed on page
3. In addition to our responses to the various consultation
documents, we are also participating in the four industry
working groups that Ofgem has established: innovation,
investment, financing, and consumers. Ofgem anticipate that
the outcome of the project will be published toward the end of
2010. It will not have any impact on the present price control,
other than necessitating a one year adapted rollover of the
existing price control, but it is expected that its conclusions will
feed through into the review for the price control commencing
April 2013.
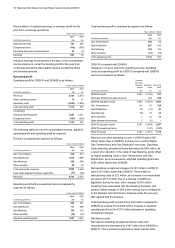
Our aim is to meet or exceed the base financial returns in our
price controls. The performance measure we use to monitor
return on investment is the vanilla return. We measure the
financial performance of our regulated businesses using an
operational return metric comparable to the vanilla return
defined in the price controls from 1 April 2007.
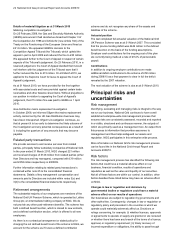
Details of these returns are summarised below.
Years ended 31 March 2010 2009
Gas Transmission operational return 7.6% 6.9%
Gas Distribution operational return 6.3% 5.7%
In Gas Transmission we significantly outperformed regulatory
assumptions mainly as a result of a strong performance under
our incentive schemes. Gas Distribution also outperformed its
regulatory allowance.
Modernising and extending the network
We aim to invest the amount required to maintain a safe and
reliable system, and to accommodate new patterns of supply
and demand. Capital investment is one of the principal drivers
to future growth.
The principal measure we use to monitor organic investment is
capital expenditure, which includes investment in property, plant
and equipment as well as internally created intangible assets
such as software.
Our capital investment plans reflect changing energy
infrastructure requirements. Our capital investment programme
takes place within defined regulatory frameworks that permit us
to earn a return on allowed investments.
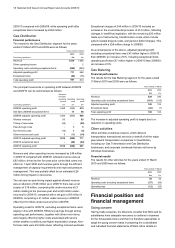
Capital investment
Total capital expenditure during 2009/10 was £972 million
compared to £1,080 million in 2008/09. More detail on capital
expenditure by business is provided below.
Gas Transmission
Investment in gas transmission systems is, by its nature,
variable and is largely driven by changing sources of supply
and asset replacement requirements. The gas transporter
licence also obliges us to provide connections and capacity on
request.
Parts of the gas transmission network are reaching the end of
their technical lives. These are mainly compressor stations,
control systems and valves. This, together with work required to
meet changing supply sources, means that the gas
transmission business will continue to see a significant increase
in investment and network renewal.
Capital investment in the replacement, reinforcement and
extension of the Gas Transmission system in 2009/10 was
£232 million, compared with £389 million in 2008/09. This
mainly related to load related infrastructure on the gas
transmission system. Capital investment included £13 million
with respect to intangible assets, principally software
applications (2008/09: £18 million).
Gas Distribution
Gross Capital investment including reinforcement, extension
and replacement of the gas distribution network was £670
million in 2009/10 compared with £598 million in 2008/09. Of
these amounts, £465 million in 2009/10 related to replacement
expenditure that is capitalised (2008/09: £425 million) and £205
million to other capital investment (2008/09: £173 million).
Expenditure on software applications included within the above
amounts was £54 million (2008/09: £22 million). The increase in
expenditure is primarily driven by the Gas Distribution front
office system (see page 13).
Replacement expenditure increased by £40 million (9%)
compared with 2008/09 reflecting an increase in workload in
London ahead of the 2012 Olympics and a higher proportion of
complex large diameter main. Performance under the mains
replacement incentive scheme is expected to be broadly neutral
in 2009/10.
In collaboration with gas alliance and coalition partnerships,
NGG has replaced more than 2,000 kilometres of metallic gas
main this year and more than 14,000 kilometres since 2002/03.