National Grid 2010 Annual Report Download - page 70
Download and view the complete annual report
Please find page 70 of the 2010 National Grid annual report below. You can navigate through the pages in the report by either clicking on the pages listed below, or by using the keyword search tool below to find specific information within the annual report.-
 1
1 -
2
-
3
-
4
-
5
-
6
-
7
-
8
-
9
-
10
-
11
-
12
-
13
-
14
-
15
-
16
-
17
-
18
-
19
-
20
-
21
-
22
-
23
-
24
-
25
-
26
-
27
-
28
-
29
-
30
-
31
-
32
-
33
-
34
-
35
-
36
-
37
-
38
-
39
-
40
-
41
-
42
-
43
-
44
-
45
-
46
-
47
-
48
-
49
-
50
-
51
-
52
-
53
-
54
-
55
-
56
-
57
-
58
-
59
-
 60
60 -
 61
61 -
 62
62 -
 63
63 -
 64
64 -
 65
65 -
 66
66 -
 67
67 -
 68
68 -
 69
69 -
 70
70 -
 71
71 -
 72
72 -
 73
73 -
 74
74 -
 75
75 -
 76
76 -
 77
77 -
 78
78 -
 79
79 -
 80
80 -
81
-
82
-
83
-
84
-
85
-
86
-
87
 |
 |

68 National Grid Gas plc Annual Report and Accounts 2009/10
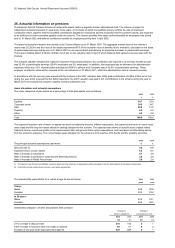
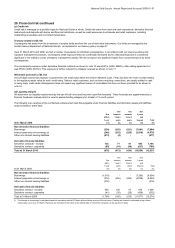
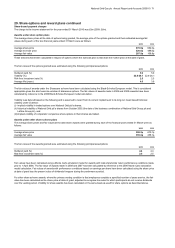
28. Financial risk continued
(e) Sensitivity analysis
The following assumptions were made in calculating the sensitivity analysis:
•
•
•
•
•
•
•
•
2010 2009
Other Other
Income Equity Income Equity
statement Reserves statement Reserves
-/+ £m -/+ £m -/+ £m -/+ £m
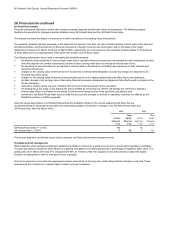
UK Retail Prices Index +/- 0.50% 10 - 10 -
UK interest rates +/- 0.50% 516 716
The income statement sensitivities impact interest expense and financial instrument remeasurements.
(f) Capital and risk managemen
t
Using the above assumptions, the following table shows the illustrative impact on the income statement and items that are
recognised directly in equity that would result from reasonably possible movements in changes in the UK Retail Prices Index and
UK interest rates, after the effects of tax.
the sensitivity of accrued interest to movements in interest rates is calculated on net floating rate exposures on debt, deposits and
derivative instruments;
The sensitivity analysis has been prepared on the basis that the amount of net debt, the ratio of fixed to floating interest rates of the debt and
derivatives portfolio, and the proportion of financial instruments in foreign currencies are all constant, and on the basis of the hedge
designations in place at 31 March 2010 and 31 March 2009, respectively. As a consequence, this sensitivity analysis relates to the positions
at those dates and is not representative of the years then ended, as all of these varied.
all other changes in the carrying value of derivative financial instruments designated as hedges are fully effective with no impact on the
income statement;
changes in the carrying value of derivatives from movements in interest rates designated as cash flow hedges are assumed to be
recorded fully within equity;
Financial instruments affected by market risk include borrowings, deposits and derivative financial instruments. The following analysis
illustrates the sensitivity to changes in market variables, being UK interest rates and the UK Retail Prices Index.
debt with a maturity below one year is floating rate for the accrued interest part of the calculation;
sensitivity to the Retail Prices Index does not take into account any changes to revenue or operating costs that are affected by the
Retail Prices Index or inflation generally.
the floating leg of any swap or any floating rate debt is treated as not having any interest rate already set, therefore a change in
interest rates affects a full twelve-month period for the accrued interest portion of the sensitivity calculations; and
the balance sheet sensitivity to interest rates relates only to derivative financial instruments and available-for-sale investments, as debt
and other deposits are carried at amortised cost and so their carrying value does not change as interest rates move;
changes in the carrying value of derivative financial instruments not in hedging relationships only affect the income statement;
NGG's objective when managing capital is to safeguard its ability to continue as a going concern and to remain within regulatory constraints.
The principal measure of balance sheet efficiency is gearing calculated as net debt expressed as a percentage of regulatory asset value. The
gearing ratio at 31 March 2010 was 57% compared with 60% at 31 March 2009. We regularly review and maintain or adjust the capital
structure as appropriate in order to manage the level of gearing.
Our licence and some of our bank loan agreements impose lower limits for the long-term credit ratings that the Company must hold. These
requirements are monitored on a regular basis in order to ensure compliance.
The analysis excludes the impact of movements in market variables on the carrying value of provisions.