National Grid 2010 Annual Report Download - page 44
Download and view the complete annual report
Please find page 44 of the 2010 National Grid annual report below. You can navigate through the pages in the report by either clicking on the pages listed below, or by using the keyword search tool below to find specific information within the annual report.-
 1
1 -
2
-
3
-
4
-
5
-
6
-
7
-
8
-
9
-
10
-
11
-
12
-
13
-
14
-
15
-
16
-
17
-
18
-
19
-
20
-
21
-
22
-
23
-
24
-
25
-
26
-
27
-
28
-
29
-
30
-
31
-
32
-
33
-
 34
34 -
 35
35 -
 36
36 -
 37
37 -
 38
38 -
 39
39 -
 40
40 -
 41
41 -
 42
42 -
 43
43 -
 44
44 -
 45
45 -
 46
46 -
 47
47 -
 48
48 -
 49
49 -
 50
50 -
 51
51 -
 52
52 -
 53
53 -
 54
54 -
55
-
56
-
57
-
58
-
59
-
60
-
61
-
62
-
63
-
64
-
65
-
66
-
67
-
68
-
69
-
70
-
71
-
72
-
73
-
74
-
75
-
76
-
77
-
78
-
79
-
80
-
81
-
82
-
83
-
84
-
85
-
86
-
87
 |
 |

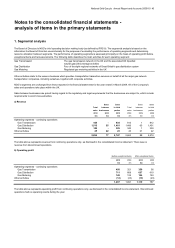
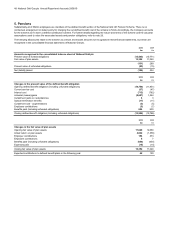
42 National Grid Gas plc Annual Report and Accounts 2009/10
Consolidated cash flow statement
for the years ended 31 March
2010 2009
Notes
£m £m
Cash flows from operating activities
Total operating profit 1,110 767
A
djustments for:
Exceptional items
4
187 324
Depreciation and amortisation
1(c)
432 415
Profit on disposal of property, plant and equipment 9(2)
Share based payment charge 86
Changes in working capital 242 (245)
Changes in provisions 71
Cash flows relating to exceptional items (123) (261)
Cash generated from operations 1,872 1,005
Tax paid (309) (71)
Net cash inflow from operating activities 1,563 934
Cash flows from investing activities
Purchases of intangible assets (68) (32)
Purchases of property, plant and equipment (884) (957)
Disposals of property, plant and equipment -14
Interest received 319
Purchases of financial investments (307) (500)
Disposal of financial investments 990 9
Net cash flow used in investing activities (266) (1,447)
Cash flows from financing activities
Proceeds from loans received 306 1,829
Repayment of loans (930) (1,389)
Net movements in short-term borrowings and derivatives (101) 682
Interest paid (276) (318)
Dividends paid to shareholders
8
(300) (300)
Net cash flow used in/from financing activities (1,301) 504
Net decrease in cash and cash equivalents (4) (9)
Cash and cash equivalents at the start of the year (i) (10) (1)
Net cash and cash equivalents at the end of the year (i)
16
(14) (10)
(i) Net of bank overdraft of £15m (2009: £10m).