National Grid 2010 Annual Report Download - page 18
Download and view the complete annual report
Please find page 18 of the 2010 National Grid annual report below. You can navigate through the pages in the report by either clicking on the pages listed below, or by using the keyword search tool below to find specific information within the annual report.-
 1
1 -
2
-
3
-
4
-
5
-
6
-
7
-
 8
8 -
 9
9 -
 10
10 -
 11
11 -
 12
12 -
 13
13 -
 14
14 -
 15
15 -
 16
16 -
 17
17 -
 18
18 -
 19
19 -
 20
20 -
 21
21 -
 22
22 -
 23
23 -
 24
24 -
 25
25 -
 26
26 -
 27
27 -
 28
28 -
29
-
30
-
31
-
32
-
33
-
34
-
35
-
36
-
37
-
38
-
39
-
40
-
41
-
42
-
43
-
44
-
45
-
46
-
47
-
48
-
49
-
50
-
51
-
52
-
53
-
54
-
55
-
56
-
57
-
58
-
59
-
60
-
61
-
62
-
63
-
64
-
65
-
66
-
67
-
68
-
69
-
70
-
71
-
72
-
73
-
74
-
75
-
76
-
77
-
78
-
79
-
80
-
81
-
82
-
83
-
84
-
85
-
86
-
87
 |
 |

16 National Grid Gas plc Annual Report and Accounts 2009/10
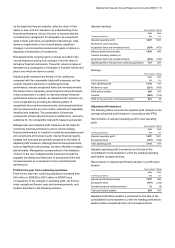
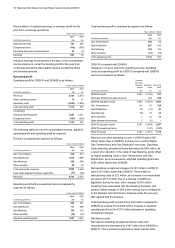
Reconciliation of adjusted earnings to earnings (profit for the
year from continuing operations)
Years ended 31 March
2010 2009
Continuing operations £m £m
Adjusted earnings 721 297
Exceptional items (143) (243)
Derivative financial remeasurements 23 (6)
Earnings 601 48
Adjusted earnings is presented on the face of the consolidated
income statement, under the heading profit for the year from
continuing operations after taxation before exceptional items
and remeasurements.
Operating profit
Operating profit for 2009/10 and 2008/09 is as follows:
Years ended 31 March
2010 2009
Continuing operations £m £m
Revenue 2,747 2,574
Other operating income 14 27
Operating costs (1,651) (1,834)
Total operating profit 1,110 767
Comprising:
Adjusted operating profit 1,297 1,091
Exceptional items (187) (324)
Total operating profit 1,110 767
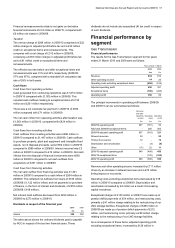
The following tables set out the consolidated revenue, adjusted
operating profit and operating profit by segment.
Revenue is analysed by segment as follows:
Years ended 31 March
2010 2009
Continuing operations £m £m
Gas Transmission 934 813
Gas Distribution 1,516 1,466
Gas Metering 329 340
Other activities 45 43
Total segmental revenues 2,824 2,662
Less: sales between business segments (77) (88)
Revenue 2,747 2,574
Operating profit before exceptional items is analysed by
segment as follows:
Years ended 31 March
2010 2009
Continuing operations £m £m
Gas Transmission 450 321
Gas Distribution 711 668
Gas Metering 148 125
Other activities (12) (23)
Adjusted operating profit 1,297 1,091
Total operating profit is analysed by segment as follows:
Years ended 31 March
2010 2009
Continuing operations £m £m
Gas Transmission 350 56
Gas Distribution 667 610
Gas Metering 106 124
Other activities (13) (23)
Total operating profit 1,110 767
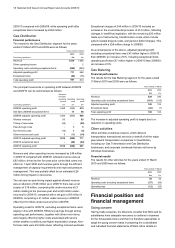
2009/10 compared with 2008/09
Changes in revenue and other operating income, operating
costs and operating profit for 2009/10 compared with 2008/09
can be summarised as follows:
Revenue
and other
operating
income
Operating
costs
Operating
profit
Continuing operations £m £m £m
2008/09 results 2,601 (1,834) 767
Add back 2008/09 exceptional items - 324 324
2008/09 adjusted results 2,601 (1,510) 1,091
Gas Transmission 111 18 129
Gas Distribution 53 (10) 43
Gas Metering (10) 33 23
Other activities 1 10 11
Sales between businesses 5 (5) -
2009/10 adjusted results 2,761 (1,464) 1,297
2009/10 exceptional items - (187) (187)
2009/10 results 2,761 (1,651) 1,110
Revenue and other operating income in 2009/10 was £160
million higher than in 2008/09, primarily as a result of higher
Gas Transmission and Gas Distribution revenues. Operating
costs excluding exceptional items decreased by £46 million; as
a result of a reduction in the costs of Gas Metering, partly offset
by higher operating costs in Gas Transmission and Gas
Distribution. As a consequence, adjusted operating profit was
£206 million higher than 2008/09.
Net operating exceptional charges of £187 million in 2009/10
were £137 million lower than 2008/09. These relate to
restructuring costs of £72 million, an increase in environmental
provisions of £14 million due to a change in landfill tax
legislation during the year, other charges of £43 million
including those associated with the Metering business, and
pension deficit charges of £58 million arising from contributions
to the National Grid UK Pension Scheme under the recovery
plan agreed with the trustees.
Total operating profit increased by £343 million compared to
2008/09 as a result of the £206 million increase in adjusted
operating profit and the £137 million decrease in operating
exceptional charges.
Net finance costs
Net interest excluding exceptional finance costs and
remeasurements decreased by £147 million from 2008/09 to
2009/10. This is primarily explained by lower interest rates.