National Grid 2010 Annual Report Download - page 55
Download and view the complete annual report
Please find page 55 of the 2010 National Grid annual report below. You can navigate through the pages in the report by either clicking on the pages listed below, or by using the keyword search tool below to find specific information within the annual report.-
 1
1 -
2
-
3
-
4
-
5
-
6
-
7
-
8
-
9
-
10
-
11
-
12
-
13
-
14
-
15
-
16
-
17
-
18
-
19
-
20
-
21
-
22
-
23
-
24
-
25
-
26
-
27
-
28
-
29
-
30
-
31
-
32
-
33
-
34
-
35
-
36
-
37
-
38
-
39
-
40
-
41
-
42
-
43
-
44
-
 45
45 -
 46
46 -
 47
47 -
 48
48 -
 49
49 -
 50
50 -
 51
51 -
 52
52 -
 53
53 -
 54
54 -
 55
55 -
 56
56 -
 57
57 -
 58
58 -
 59
59 -
 60
60 -
 61
61 -
 62
62 -
 63
63 -
 64
64 -
 65
65 -
66
-
67
-
68
-
69
-
70
-
71
-
72
-
73
-
74
-
75
-
76
-
77
-
78
-
79
-
80
-
81
-
82
-
83
-
84
-
85
-
86
-
87
 |
 |

National Grid Gas plc Annual Report and Accounts 2009/10 53
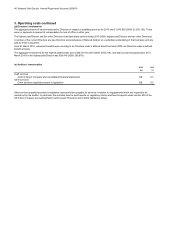
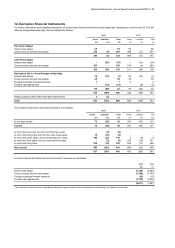
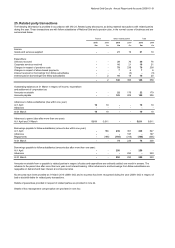
12. Derivative financial instruments
2010 2009
Asset Liabilities Total Asset Liabilities Total
£m £m £m £m £m £m
Fair value hedges
Interest rate swaps 65 - 65 98 - 98
Cross-currency interest rate swaps 275 (6) 269 488 (11) 477
340 (6) 334 586 (11) 575
Cash flow hedges
Interest rate swaps - (55) (55) 1 (31) (30)
Cross-currency interest rate swaps 185 - 185 210 (4) 206
185 (55) 130 211 (35) 176
Derivatives not in a formal hedge relationship
Interest rate swaps 74 (75) (1) 53 (57) (4)
Cross-currency interest rate swaps 35 - 35 39 - 39
Forward exchange forward contract
s
1-13-3
Forward rate agreements - (13) (13) - (6) (6)
110 (88) 22 95 (63) 32
635 (149) 486 892 (109) 783
Hedge positions offset within derivative instruments 2 (2) - ---
Total 637 (151) 486 892 (109) 783
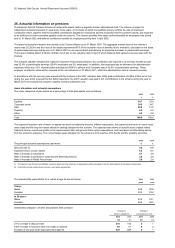
The maturity of derivative financial instruments is as follows:
2010 2009
Assets Liabilities Total Assets Liabilities Total
£m £m £m £m £m £m
In one year or less 72 (30) 42 204 (67) 137
Current 72 (30) 42 204 (67) 137
In more than one year, but not more than two years - (6) (6) ---
In more than two years, but not more than three years 15 (19) (4) ---
In more than three years, but not more than four years 140 (22) 118 5 (6) (1)
In more than four years, but not more than five years - (2) (2) 160 (19) 141
In more than five years 410 (72) 338 523 (17) 506
Non-curren
t
565 (121) 444 688 (42) 646
637 (151) 486 892 (109) 783
2010 2009
£m £m
Interest rate swaps (3,154) (2,924)
Cross-currency interest rate swaps (1,748) (1,707)
Foreign exchange forward contracts (39) (15)
Forward rate agreements (1,730) (3,345)
(6,671) (7,991)
*The notional contract amounts of derivatives indicate the gross nominal value of transactions outstanding at the balance sheet date.
For further information and a detailed description of our derivative financial instruments and hedge type designations, refer to note 27. The fair
value by designated hedge type can be analysed as follows:
For each class of derivative the notional contract* amounts are as follows: