Motorola 2015 Annual Report Download - page 81
Download and view the complete annual report
Please find page 81 of the 2015 Motorola annual report below. You can navigate through the pages in the report by either clicking on the pages listed below, or by using the keyword search tool below to find specific information within the annual report.-
 1
1 -
2
-
3
-
4
-
5
-
6
-
7
-
8
-
9
-
10
-
11
-
12
-
13
-
14
-
15
-
16
-
17
-
18
-
19
-
20
-
21
-
22
-
23
-
24
-
25
-
26
-
27
-
28
-
29
-
30
-
31
-
32
-
33
-
34
-
35
-
36
-
37
-
38
-
39
-
40
-
41
-
42
-
43
-
44
-
45
-
46
-
47
-
48
-
49
-
50
-
51
-
52
-
53
-
54
-
55
-
56
-
57
-
58
-
59
-
60
-
61
-
62
-
63
-
64
-
65
-
66
-
67
-
68
-
69
-
70
-
 71
71 -
 72
72 -
 73
73 -
 74
74 -
 75
75 -
 76
76 -
 77
77 -
 78
78 -
 79
79 -
 80
80 -
 81
81 -
 82
82 -
 83
83 -
 84
84 -
 85
85 -
 86
86 -
 87
87 -
 88
88 -
 89
89 -
 90
90 -
 91
91 -
92
-
93
-
94
-
95
-
96
-
97
-
98
-
99
-
100
-
101
-
102
-
103
 |
 |

80
December 31, 2014 Level 1 Level 2 Total
Common stock and equivalents $ 194 $ — $ 194
Commingled equity funds — 569 569
Government, agency, and government-sponsored enterprise obligations —2626
Corporate bonds — 316 316
Commingled bond funds — 399 399
Commingled short-term investment funds —99
Total investment securities $ 194 $ 1,319 $ 1,513
Cash 233
Accrued income receivable 5
Insurance contracts 55
Fair value plan assets $ 1,806
The table above includes securities on loan as part of a securities lending arrangement of $16 million of common stock and
equivalents, and $12 million of corporate bonds. All securities on loan were fully collateralized.
There were no significant transfers between Level 1 and Level 2 during 2015 or 2014.
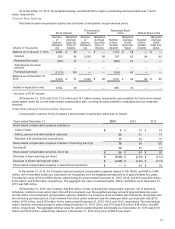
Postretirement Health Care Benefits Plan
December 31, 2015 Level 1 Level 2 Total
Common stock and equivalents $4$—$4
Commingled equity funds —7171
Government, agency, and government-sponsored enterprise obligations —55
Other government bonds —33
Corporate bonds —4040
Commingled short-term investment funds —1414
Invested cash —66
Fair value plan assets $ 4$139$143
The table above includes no securities on loan as part of a securities lending arrangement.
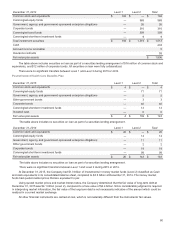
December 31, 2014 Level 1 Level 2 Total
Common stock and equivalents $20$—$20
Commingled equity funds —1313
Government, agency, and government-sponsored enterprise obligations —1111
Other government bonds —22
Corporate bonds —1818
Commingled short-term investment funds —9999
Fair value plan assets $20$143$163
The table above includes no securities on loan as part of a securities lending arrangement.
There were no significant transfers between Level 1 and Level 2 during 2015 or 2014.
At December 31, 2015, the Company had $1.3 billion of investments in money market funds (Level 2) classified as Cash
and cash equivalents in its consolidated balance sheet, compared to $3.3 billion at December 31, 2014. The money market
funds had quoted market prices that are equivalent to par.
Using quoted market prices and market interest rates, the Company determined that the fair value of long-term debt at
December 31, 2015 was $4.1 billion (Level 2), compared to a face value of $4.4 billion. Since considerable judgment is required
in interpreting market information, the fair value of the long-term debt is not necessarily indicative of the amount which could be
realized in a current market exchange.
All other financial instruments are carried at cost, which is not materially different from the instruments’ fair values.