Motorola 2015 Annual Report Download - page 33
Download and view the complete annual report
Please find page 33 of the 2015 Motorola annual report below. You can navigate through the pages in the report by either clicking on the pages listed below, or by using the keyword search tool below to find specific information within the annual report.-
 1
1 -
2
-
3
-
4
-
5
-
6
-
7
-
8
-
9
-
10
-
11
-
12
-
13
-
14
-
15
-
16
-
17
-
18
-
19
-
20
-
21
-
22
-
 23
23 -
 24
24 -
 25
25 -
 26
26 -
 27
27 -
 28
28 -
 29
29 -
 30
30 -
 31
31 -
 32
32 -
 33
33 -
 34
34 -
 35
35 -
 36
36 -
 37
37 -
 38
38 -
 39
39 -
 40
40 -
 41
41 -
 42
42 -
 43
43 -
44
-
45
-
46
-
47
-
48
-
49
-
50
-
51
-
52
-
53
-
54
-
55
-
56
-
57
-
58
-
59
-
60
-
61
-
62
-
63
-
64
-
65
-
66
-
67
-
68
-
69
-
70
-
71
-
72
-
73
-
74
-
75
-
76
-
77
-
78
-
79
-
80
-
81
-
82
-
83
-
84
-
85
-
86
-
87
-
88
-
89
-
90
-
91
-
92
-
93
-
94
-
95
-
96
-
97
-
98
-
99
-
100
-
101
-
102
-
103
 |
 |
32
Our effective tax rate will change from period to period based on non-recurring events, such as the settlement of income
tax audits, changes in valuation allowances, and the tax impact of significant unusual or extraordinary items, as well as recurring
factors including changes in the geographic mix of income and effects of various global income tax strategies.
Earnings (Loss) from Continuing Operations Attributable to Motorola Solutions, Inc.
After taxes, we had earnings from continuing operations attributable to Motorola Solutions, Inc. of $640 million, or $3.17
per diluted share, in 2015, compared to a net loss from continuing operations attributable to Motorola Solutions, Inc. of $697
million, or $(2.84) per diluted share, in 2014.
The increase in earnings from continuing operations in 2015, as compared to 2014, was primarily driven by: (i) a $1.9
billion decrease in Other charges, (ii) a $163 million decrease in SG&A, and (iii) a $61 million decrease in R&D. The increase in
earnings from continuing operations per diluted share was driven by a reduction in shares outstanding, primarily as a result of
our "Dutch auction" tender offer, as well as repurchases made through our ongoing share repurchase program, and an increase
in earnings from continuing operations.
Earnings from Discontinued Operations
After taxes, we had a $30 million, or $0.15 per diluted share, loss from discontinued operations in 2015, compared to
earnings from discontinued operations of $2.0 billion, or $8.13 per diluted share, in 2014. The earnings from discontinued
operations in both 2015 and 2014 were primarily related to the sale of the Enterprise business.
Results of Operations—2014 Compared to 2013
Net Sales
Net sales were $5.9 billion in 2014, down $346 million, or 6% compared to $6.2 billion in 2013. The decline in net sales is
reflective of decreases in North America, AP, and Latin America, partially offset by growth in EA and ME. The decrease in North
America was a result of lower Products and Services sales, driven by reduced devices and systems sales and iDen services.
The decreases in Latin America and AP were primarily the result of lower Products sales. EA and ME grew on strong Products
and Services sales.
Gross Margin
Gross margin was $2.8 billion, or 48.1% of net sales in 2014, compared to $3.1 billion, or 49.9% of net sales, in 2013. The
decrease in gross margin percentage is attributable to: (i) a decline in gross margin as a percentage of sales within the Services
segment in North America, (ii) lower net sales of iDEN services in Latin America, which have slightly higher gross margin
percentage compared to the rest of the Services portfolio, and (iii) a decrease in gross margin as a percentage of sales in EA as
a result of the mix of projects in the field.
Selling, General and Administrative Expenses
SG&A expenses decreased 11% to $1.2 billion, or 20.1% of net sales in 2014, compared to $1.3 billion, or 21.4% of net
sales in 2013. The decrease in SG&A is primarily due to: (i) the reduction of sales support costs by lowering our overall non-
quota carrying employee base, (ii) lower pension expenses, (iii) lower incentive compensation expenses, and (iv) reduced costs
through the increased use of centralized services.
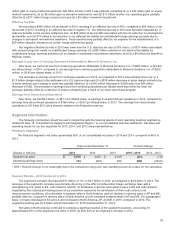
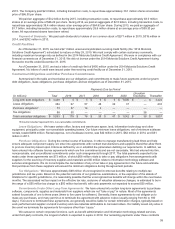
Research and Development Expenditures
R&D expenditures decreased 11% to $681 million, or 11.6% of net sales in 2014, compared to $761 million, or 12.2% of net
sales in 2013. The decrease in R&D expenditures is primarily due to: (i) headcount reductions enacted during previous periods,
(ii) lower incentive compensation expenses, (iii) the consolidation of testing processes and lab sites, and (iv) the movement of
employees to lower cost work sites.
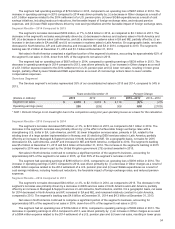
Other Charges
We recorded net charges of $2.0 billion in Other charges in 2014, compared to net charges of $71 million in 2013. The
charges in 2014 included: (i) a $1.9 billion charge related to the settlement of a U.S. pension plan, (ii) $64 million of net
reorganization of business charges, (iii) $8 million of legal settlement charges, and (iv) $4 million of charges relating to the
amortization of intangibles, partially offset by a $21 million gain on the sale of a building and land. The charges in 2013 included:
(i) $70 million of net reorganization of business charges and (ii) $1 million of charges relating to amortization of intangibles.
Net Interest Expense
Net interest expense was $126 million in 2014, compared to net interest expense of $113 million in 2013. The increase in
interest expense in 2014 compared to 2013 was a result of higher average debt balances.
Gains on Sales of Investments
Gains on sales of investments were $5 million in 2014, compared to $37 million in 2013. The net gains in 2014 and 2013
were related to the sales of equity investments.
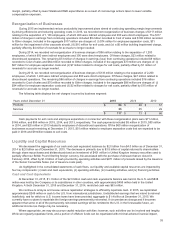
Other
Net Other expense was $34 million in 2014, compared to net Other income of $9 million in 2013. The net Other expense in
2014 was primarily comprised of: (i) a $37 million loss on the extinguishment of debt, (ii) a $4 million loss on derivative
instruments, (iii) a $3 million foreign currency loss, and (iv) $6 million of other non-operating losses, partially offset by a $16