Motorola 2015 Annual Report Download - page 78
Download and view the complete annual report
Please find page 78 of the 2015 Motorola annual report below. You can navigate through the pages in the report by either clicking on the pages listed below, or by using the keyword search tool below to find specific information within the annual report.-
 1
1 -
2
-
3
-
4
-
5
-
6
-
7
-
8
-
9
-
10
-
11
-
12
-
13
-
14
-
15
-
16
-
17
-
18
-
19
-
20
-
21
-
22
-
23
-
24
-
25
-
26
-
27
-
28
-
29
-
30
-
31
-
32
-
33
-
34
-
35
-
36
-
37
-
38
-
39
-
40
-
41
-
42
-
43
-
44
-
45
-
46
-
47
-
48
-
49
-
50
-
51
-
52
-
53
-
54
-
55
-
56
-
57
-
58
-
59
-
60
-
61
-
62
-
63
-
64
-
65
-
66
-
67
-
 68
68 -
 69
69 -
 70
70 -
 71
71 -
 72
72 -
 73
73 -
 74
74 -
 75
75 -
 76
76 -
 77
77 -
 78
78 -
 79
79 -
 80
80 -
 81
81 -
 82
82 -
 83
83 -
 84
84 -
 85
85 -
 86
86 -
 87
87 -
 88
88 -
89
-
90
-
91
-
92
-
93
-
94
-
95
-
96
-
97
-
98
-
99
-
100
-
101
-
102
-
103
 |
 |

77
As of December 31, 2015, the weighted average contractual life for options outstanding and exercisable was 7 and 5
years, respectively.
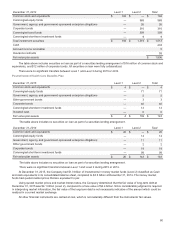
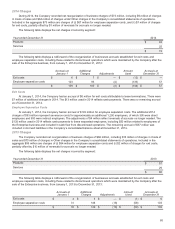
Current Year Activity
Total share-based compensation activity was as follows (in thousands, except exercise price):
Stock Options Performance
Options*
Restricted Stock
Units Market Stock Units
Shares in Thousands
Number
of
Options
Outstand
ing
Weighted
Average
Exercise
Price of
Shares
Number
of
Options
Outstand
ing
Weighted
Average
Exercise
Price of
Shares
Number
of Non-
Vested
Awards
Weighted
Average
Grant
Date Fair
Value
Number
of Non-
Vested
Awards
Weighted
Average
Grant
Date Fair
Value
Balance as of January 1, 2015 9,684 $ 85 — $ — 1,753 $ 58 — $ —
Granted 550 66 2,042 68 797 62 84 60
Releases/Exercised (892) 47 — — (885) 53 — —
Adjustments for actual
payouts ————————
Forfeited/Canceled (3,313) 155 — — (149) 60 — —
Balance as of December 31,
2015 6,029 $ 51 2,042 $ 68 1,516 $ 59 84 $ 60
Vested or expected to vest 4,604 46 — — 885 53 — —
* Inclusive of PCSO awards
At December 31, 2015 and 2014, 12.0 million and 19.7 million shares, respectively, were available for future share-based
award grants under the current share-based compensation plan, covering all equity awards to employees and non-employee
directors.
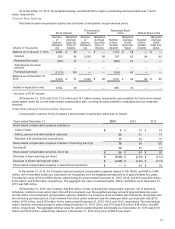
Total Share-Based Compensation Expense
Compensation expense for the Company’s share-based compensation plans was as follows:
Years ended December 31 2015 2014 2013
Share-based compensation expense included in:
Costs of sales $9$10$16
Selling, general and administrative expenses 52 61 73
Research and development expenditures 17 23 31
Share-based compensation expense included in Operating earnings 78 94 120
Tax benefit 24 30 37
Share-based compensation expense, net of tax $54$64$83
Decrease in basic earnings per share $ (0.25) $ (0.28) $ (0.31)
Decrease in diluted earnings per share $ (0.25) $ (0.28) $ (0.31)
Share-based compensation expense in discontinued operations $—$20$33
At December 31, 2015, the Company had unrecognized compensation expense related to RS, RSUs, and MSUs of $60
million, net of estimated forfeitures, expected to be recognized over the weighted average period of approximately two years.
The total fair value of RS and RSU shares vested during the years ended December 31, 2015, 2014, and 2013 was $55 million,
$160 million, and $138 million, respectively. The aggregate fair value of outstanding RS, RSUs, and MSUs as of December 31,
2015 was $95 million.
At December 31, 2015, the Company had $20 million of total unrecognized compensation expense, net of estimated
forfeitures, related to stock option plans that will be recognized over the weighted average period of approximately two years,
and $4 million of unrecognized compensation expense related to the employee stock purchase plan that will be recognized over
the remaining purchase period. Cash received from stock option exercises and the employee stock purchase plan was $100
million, $135 million, and $165 million for the years ended December 31, 2015, 2014, and 2013, respectively. The total intrinsic
value of options exercised during the years ended December 31, 2015, 2014, and 2013 was $15 million, $38 million, and $85
million, respectively. The aggregate intrinsic value for options outstanding and exercisable as of December 31, 2015 was $110
million and $102 million, respectively, based on a December 31, 2015 stock price of $68.45 per share.