Motorola 2015 Annual Report Download - page 32
Download and view the complete annual report
Please find page 32 of the 2015 Motorola annual report below. You can navigate through the pages in the report by either clicking on the pages listed below, or by using the keyword search tool below to find specific information within the annual report.-
 1
1 -
2
-
3
-
4
-
5
-
6
-
7
-
8
-
9
-
10
-
11
-
12
-
13
-
14
-
15
-
16
-
17
-
18
-
19
-
20
-
21
-
 22
22 -
 23
23 -
 24
24 -
 25
25 -
 26
26 -
 27
27 -
 28
28 -
 29
29 -
 30
30 -
 31
31 -
 32
32 -
 33
33 -
 34
34 -
 35
35 -
 36
36 -
 37
37 -
 38
38 -
 39
39 -
 40
40 -
 41
41 -
 42
42 -
43
-
44
-
45
-
46
-
47
-
48
-
49
-
50
-
51
-
52
-
53
-
54
-
55
-
56
-
57
-
58
-
59
-
60
-
61
-
62
-
63
-
64
-
65
-
66
-
67
-
68
-
69
-
70
-
71
-
72
-
73
-
74
-
75
-
76
-
77
-
78
-
79
-
80
-
81
-
82
-
83
-
84
-
85
-
86
-
87
-
88
-
89
-
90
-
91
-
92
-
93
-
94
-
95
-
96
-
97
-
98
-
99
-
100
-
101
-
102
-
103
 |
 |
31
Results of Operations—2015 Compared to 2014
Net Sales
Net sales were $5.7 billion in 2015, down $186 million, or 3%, compared to $5.9 billion in 2014. The decline in net sales is
reflective of decreases in EA and Latin America, partially offset by growth in North America, ME, and AP. The decrease in EA and
Latin America was primarily the result of lower Products and Services sales, driven by challenging macroeconomic conditions in
Latin America and Eastern Europe, and foreign exchange rate unfavorability. North America grew on strong Products and
Services sales, ME realized an increase in Services sales, and AP grew on strong Products sales.
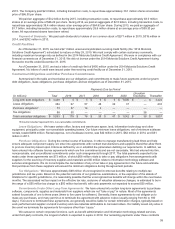
Gross Margin
Gross margin was $2.7 billion, or 47.7% of net sales in 2015, compared to $2.8 billion, or 48.1% of net sales, in 2014. The
decrease in gross margin was primarily a result of foreign exchange rate unfavorability. The decrease in gross margin
percentage is primarily attributable to a decrease in gross margin as a percentage of sales within the Services segment while the
gross margin percentage of the Products segment remained relatively flat. The decrease in gross margin percentage in the
Services segment was primarily driven by: (i) a decrease in North America Integration services margins due to the deployment of
certain large projects at lower gross margins and (ii) lower net sales in iDEN services which have a slightly higher gross margin
percentage compared to the rest of the services portfolio.
Selling, General and Administrative Expenses
SG&A expenses decreased 14% to $1.0 billion, or 17.9% of net sales in 2015, compared to $1.2 billion, or 20.1% of net
sales in 2014. The decrease in SG&A expenditures is primarily due to: (i) cost savings initiatives, including headcount
reductions, (ii) lower pension expenses, and (iii) the favorable impact of foreign exchange rates, partially offset by higher
incentive compensation accruals.
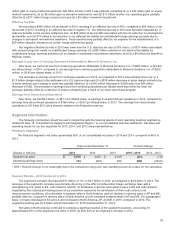
Research and Development Expenditures
R&D expenditures decreased 9% to $620 million, or 10.9% of net sales in 2015, compared to $681 million, or 11.6% of net
sales in 2014. The decrease in R&D expenditures is primarily due to: (i) cost savings initiatives, including headcount reductions,
and the movement of employees to lower cost work sites and (ii) the favorable impact of foreign exchange rates, partially offset
by higher incentive compensation accruals.
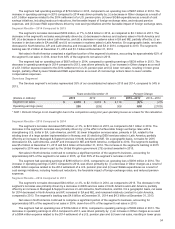
Other Charges
We recorded net charges of $84 million in Other charges in 2015, compared to net charges of $2.0 billion in 2014. The
charges in 2015 included: (i) $108 million of net reorganization of business charges, including a $31 million impairment of the
corporate aircraft and (ii) $8 million of charges relating to the amortization of intangibles, partially offset by a $32 million non-U.S.
pension curtailment gain. The charges in 2014 included: (i) a $1.9 billion charge related to the settlement of a U.S. pension plan,
(ii) $64 million of net reorganization of business charges, (iii) $8 million of legal settlement charges, and (iv) $4 million of charges
relating to the amortization of intangibles, partially offset by a $21 million gain on the sale of a building and land.
Net Interest Expense
Net interest expense was $173 million in 2015, compared to net interest expense of $126 million in 2014. The increase in
interest expense in 2015 compared to 2014 was a result of higher average debt balances.
Gains on Sales of Investments
Gains on sales of investments were $107 million in 2015, compared to $5 million in 2014. The net gains in 2015 and 2014
were related to the sales of equity investments.
Other
Net Other expense was $11 million in 2015, compared to net Other expense of $34 million in 2014. The net Other expense
in 2015 was primarily comprised of: (i) a $23 million foreign currency loss and (ii) a $6 million investment impairment, partially
offset by: (i) a $7 million gain on derivative instruments, (ii) a $6 million gain on equity method investments, and (iii) $5 million of
other non-operating gains. Net Other expense in 2014 was primarily comprised of: (i) a $37 million loss on the extinguishment of
debt, (ii) a $4 million loss on derivative instruments, (iii) a $3 million foreign currency loss, and (iv) $6 million of other non-
operating losses, partially offset by a $16 million gain on equity method investments.
Effective Tax Rate
We recorded a $274 million net tax expense in 2015, resulting in an effective tax rate of 30%, compared to $465 million of
net tax benefit in 2014, resulting in an effective tax rate of 40%. Our effective tax rate in 2015 was lower than the U.S. statutory
tax rate of 35% primarily due to lower tax rates on non-U.S. income.
Our effective tax rate in 2014 was favorably impacted by: (i) state tax benefits on the pension settlement loss, (ii) $29
million in tax benefits associated with the net reduction in unrecognized tax benefits and (iii) $19 million in net reduction in our
deferred tax liability for undistributed foreign earnings primarily due to changes in permanent reinvestment assertions. These
benefits were partially offset by tax expense for the establishment of a $55 million valuation allowance on certain foreign
deferred tax assets.