Motorola 2015 Annual Report Download - page 34
Download and view the complete annual report
Please find page 34 of the 2015 Motorola annual report below. You can navigate through the pages in the report by either clicking on the pages listed below, or by using the keyword search tool below to find specific information within the annual report.-
 1
1 -
2
-
3
-
4
-
5
-
6
-
7
-
8
-
9
-
10
-
11
-
12
-
13
-
14
-
15
-
16
-
17
-
18
-
19
-
20
-
21
-
22
-
23
-
 24
24 -
 25
25 -
 26
26 -
 27
27 -
 28
28 -
 29
29 -
 30
30 -
 31
31 -
 32
32 -
 33
33 -
 34
34 -
 35
35 -
 36
36 -
 37
37 -
 38
38 -
 39
39 -
 40
40 -
 41
41 -
 42
42 -
 43
43 -
 44
44 -
45
-
46
-
47
-
48
-
49
-
50
-
51
-
52
-
53
-
54
-
55
-
56
-
57
-
58
-
59
-
60
-
61
-
62
-
63
-
64
-
65
-
66
-
67
-
68
-
69
-
70
-
71
-
72
-
73
-
74
-
75
-
76
-
77
-
78
-
79
-
80
-
81
-
82
-
83
-
84
-
85
-
86
-
87
-
88
-
89
-
90
-
91
-
92
-
93
-
94
-
95
-
96
-
97
-
98
-
99
-
100
-
101
-
102
-
103
 |
 |

33
million gain on equity method investments. Net Other income in 2013 was primarily comprised of: (i) a $10 million gain on equity
method investments, (ii) an $8 million gain on derivative instruments, and (iii) $11 million of other non-operating gains, partially
offset by (i) a $17 million foreign currency loss and (ii) a $3 million investment impairment.
Effective Tax Rate
We recorded a $465 million net tax benefit in 2014, resulting in an effective tax rate of 40%, compared to $59 million of net
tax benefit in 2013, resulting in an effective tax rate of negative 7%. Our effective tax rate in 2014 was favorably impacted by: (i)
state tax benefits on the pension settlement loss, (ii) $29 million in tax benefits associated with the net reduction in unrecognized
tax benefits, and (iii) $19 million in net reduction in our deferred tax liability for undistributed foreign earnings primarily due to
changes in permanent reinvestment assertions. These benefits were partially offset by tax expense for the establishment of a
$55 million valuation allowance on certain foreign deferred tax assets.
Our negative effective tax rate in 2013 was lower than the U.S. statutory tax rate of 35% due to: (i) $337 million associated
with excess foreign tax credits on undistributed foreign earnings, (ii) a $25 million reduction in our deferred tax liability for
undistributed foreign earnings primarily due to changes in permanent reinvestment assertions, and (iii) a $9 million tax benefit for
R&D tax credits.
Earnings (Loss) from Continuing Operations Attributable to Motorola Solutions, Inc.
After taxes, we had a net loss from continuing operations attributable to Motorola Solutions, Inc. of $697 million, or $(2.84)
per diluted share, in 2014, compared to net earnings from continuing operations attributable to Motorola Solutions, Inc. of $933
million, or $3.45 per diluted share, in 2013.
The decrease in earnings (loss) from continuing operations in 2014, as compared to 2013, was primarily driven by: (i) a
$1.9 billion charge related to the settlement of a U.S. pension plan and (ii) a $278 million decrease in gross margin primarily due
to sales declines and a change in sales mix, partially offset by: (i) a $146 million decrease in SG&A and (ii) an $80 million
decrease in R&D. The decrease in earnings (loss) from continuing operations per diluted share was driven by lower net
earnings, partially offset by a reduction in shares outstanding as a result of our share repurchase program.
Earnings from Discontinued Operations
After taxes, we had $2.0 billion, or $8.13 per diluted share, of earnings from discontinued operations in 2014, compared to
earnings from discontinued operations of $166 million, or $0.61 per diluted share, in 2013. The earnings from discontinued
operations in 2014 and 2013 were primarily related to the Enterprise business.
Segment Information
The following commentary should be read in conjunction with the financial results of each operating business segment as
detailed in Note 12, “Information by Segment and Geographic Region,” to our consolidated financial statements. Net sales and
operating results for our two segments for 2015, 2014, and 2013 are presented below.
Products Segment
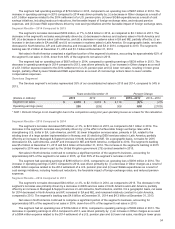
The Products segment’s net sales represented 65% of our consolidated net sales in 2015 and 2014, compared to 66% in
2013.
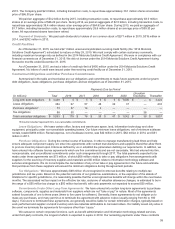
Years ended December 31 Percent Change
(Dollars in millions) 2015 2014 2013 2015—2014 2014—2013
Segment net sales $3,676$3,807$4,109 (3)% (7)%
Operating earnings (loss) 704 (667) 639 N/M (204)%
* N/M = Percent Change is not meaningful due to the comparison using prior year operating losses as a basis for the calculation.
Segment Results—2015 Compared to 2014
The segment’s net sales decreased $131 million, or 3%, to $3.7 billion in 2015, as compared to $3.8 billion in 2014. The
decrease in the segment's net sales was primarily driven by: (i) the effect of unfavorable foreign exchange rates with a
strengthening U.S. dollar in EA, Latin America, and AP, (ii) decreases in devices and systems sales in EA and Latin America
impacted by the reduced purchasing power of our customers caused by the devaluation of their local currency and
macroeconomic conditions, (iii) a decrease in systems sales in North America, and (iv) declines in devices sales in AP and ME,
partially offset by: (i) growth in devices sales in North America and (ii) increased systems sales in AP and ME. On a geographic
basis, net sales decreased in EA and LA and increased in North America, AP, and ME in 2015, compared to 2014. The
segment's backlog was $1.2 billion at both December 31, 2015 and December 31, 2014.
Net sales in North America continued to comprise a significant portion of the segment’s business, accounting for
approximately 67% of the segment’s net sales in 2015, up from 62% of the segment’s net sales in 2014.