Motorola 2015 Annual Report Download - page 77
Download and view the complete annual report
Please find page 77 of the 2015 Motorola annual report below. You can navigate through the pages in the report by either clicking on the pages listed below, or by using the keyword search tool below to find specific information within the annual report.-
 1
1 -
2
-
3
-
4
-
5
-
6
-
7
-
8
-
9
-
10
-
11
-
12
-
13
-
14
-
15
-
16
-
17
-
18
-
19
-
20
-
21
-
22
-
23
-
24
-
25
-
26
-
27
-
28
-
29
-
30
-
31
-
32
-
33
-
34
-
35
-
36
-
37
-
38
-
39
-
40
-
41
-
42
-
43
-
44
-
45
-
46
-
47
-
48
-
49
-
50
-
51
-
52
-
53
-
54
-
55
-
56
-
57
-
58
-
59
-
60
-
61
-
62
-
63
-
64
-
65
-
66
-
 67
67 -
 68
68 -
 69
69 -
 70
70 -
 71
71 -
 72
72 -
 73
73 -
 74
74 -
 75
75 -
 76
76 -
 77
77 -
 78
78 -
 79
79 -
 80
80 -
 81
81 -
 82
82 -
 83
83 -
 84
84 -
 85
85 -
 86
86 -
 87
87 -
88
-
89
-
90
-
91
-
92
-
93
-
94
-
95
-
96
-
97
-
98
-
99
-
100
-
101
-
102
-
103
 |
 |

76
than $25,000 of stock in any calendar year. The price an employee pays per share is 85% of the lower of the fair market value of
the Company’s stock on the close of the first trading day or last trading day of the purchase period. The plan has two purchase
periods, the first from October 1 through March 31 and the second from April 1 through September 30. For the years ended
December 31, 2015, 2014 and 2013, employees purchased 1.0 million, 1.4 million and 1.5 million shares, respectively, at
purchase prices of $52.99 and $56.67, $51.76 and $53.79, and $43.02 and $50.47, respectively.
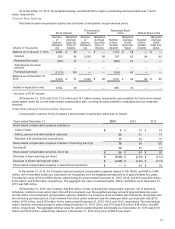
Significant Assumptions Used in the Estimate of Fair Value
The Company calculates the value of each employee stock option, estimated on the date of grant, using the Black-Scholes
option pricing model. The weighted-average estimated fair value of employee stock options granted during 2015, 2014 and 2013
was $10.21, $11.02 and $9.52, respectively, using the following weighted-average assumptions:
2015 2014 2013
Expected volatility 20.0% 21.7% 22.1%
Risk-free interest rate 1.6% 1.6% 0.9%
Dividend yield 2.9% 2.5% 2.4%
Expected life (years) 6.0 5.2 5.9
The Company calculates the value of each performance option, MSU, and PCSO using the Monte Carlo Simulation,
estimated on the date of grant. The fair value of performance options, MSUs, and PCSOs granted during 2015 was $17.42,
$60.37, and $3.97, respectively, using the following assumptions:
Performance
Options
Market Stock
Units PCSOs
Expected volatility of common stock 21.0% 19.3% 26.0%
Expected volatility of the S&P 500 23.3% n/a n/a
Risk-free interest rate 1.8% 1.1% 1.5%
Dividend yield 2.9% 2.9% 3.1%
Expected life (years) 6.5 n/a 5
The Company uses the implied volatility for traded options on the Company’s stock as the expected volatility assumption
in the valuation of stock options, MSUs, and PCSOs. The selection of the implied volatility approach was based upon the
availability of actively traded options on the Company’s stock and the Company’s assessment that implied volatility is more
representative of future stock price trends than historical volatility. The Company uses the historical volatility as the expected
volatility assumption in the valuation of performance options in order to calculate the correlation coefficients between the S&P
500 and the Company's stock, which can only be calculated using historical data.
The risk-free interest rate assumption is based upon the average daily closing rates during the year for U.S. Treasury
notes that have a life which approximates the expected life of the grant. The dividend yield assumption is based on the
Company’s future expectation of dividend payouts. The expected life represents the average of the contractual term of the
options and the weighted-average vesting period for all option tranches.
The Company has applied forfeiture rates, estimated based on historical data, of 10%-50% to the stock option fair values
calculated by the Black-Scholes option pricing model. These estimated forfeiture rates are applied to grants based on their
remaining vesting term and may be revised in subsequent periods if actual forfeitures differ from these estimates.
The following table summarizes information about the total stock options outstanding and exercisable under all stock
option plans, including performance options and PCSOs, at December 31, 2015 (in thousands, except exercise price and years):
Options Outstanding Options Exercisable
Exercise price range
No. of
options
Wtd. avg.
Exercise
Price
Wtd. avg.
contractual
life (in yrs.)
No. of
options
Wtd. avg.
Exercise
Price
Wtd. avg.
contractual
life (in yrs.)
Under $30 551 $ 27 4 551 $ 27 4
$30-$40 2,047 39 4 2,047 39 4
$41-$50 106 45 5 106 45 5
$51-$60 1,482 55 7 1,119 54 7
$61-$70 3,593 67 9 213 65 8
$71-$80 165 74 2 158 74 1
$81 and over 127 89 0 127 89 0
8,071 4,321