Motorola 2015 Annual Report Download - page 26
Download and view the complete annual report
Please find page 26 of the 2015 Motorola annual report below. You can navigate through the pages in the report by either clicking on the pages listed below, or by using the keyword search tool below to find specific information within the annual report.-
 1
1 -
2
-
3
-
4
-
5
-
6
-
7
-
8
-
9
-
10
-
11
-
12
-
13
-
14
-
15
-
 16
16 -
 17
17 -
 18
18 -
 19
19 -
 20
20 -
 21
21 -
 22
22 -
 23
23 -
 24
24 -
 25
25 -
 26
26 -
 27
27 -
 28
28 -
 29
29 -
 30
30 -
 31
31 -
 32
32 -
 33
33 -
 34
34 -
 35
35 -
 36
36 -
37
-
38
-
39
-
40
-
41
-
42
-
43
-
44
-
45
-
46
-
47
-
48
-
49
-
50
-
51
-
52
-
53
-
54
-
55
-
56
-
57
-
58
-
59
-
60
-
61
-
62
-
63
-
64
-
65
-
66
-
67
-
68
-
69
-
70
-
71
-
72
-
73
-
74
-
75
-
76
-
77
-
78
-
79
-
80
-
81
-
82
-
83
-
84
-
85
-
86
-
87
-
88
-
89
-
90
-
91
-
92
-
93
-
94
-
95
-
96
-
97
-
98
-
99
-
100
-
101
-
102
-
103
 |
 |
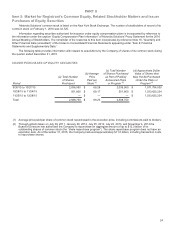
25
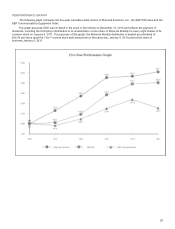
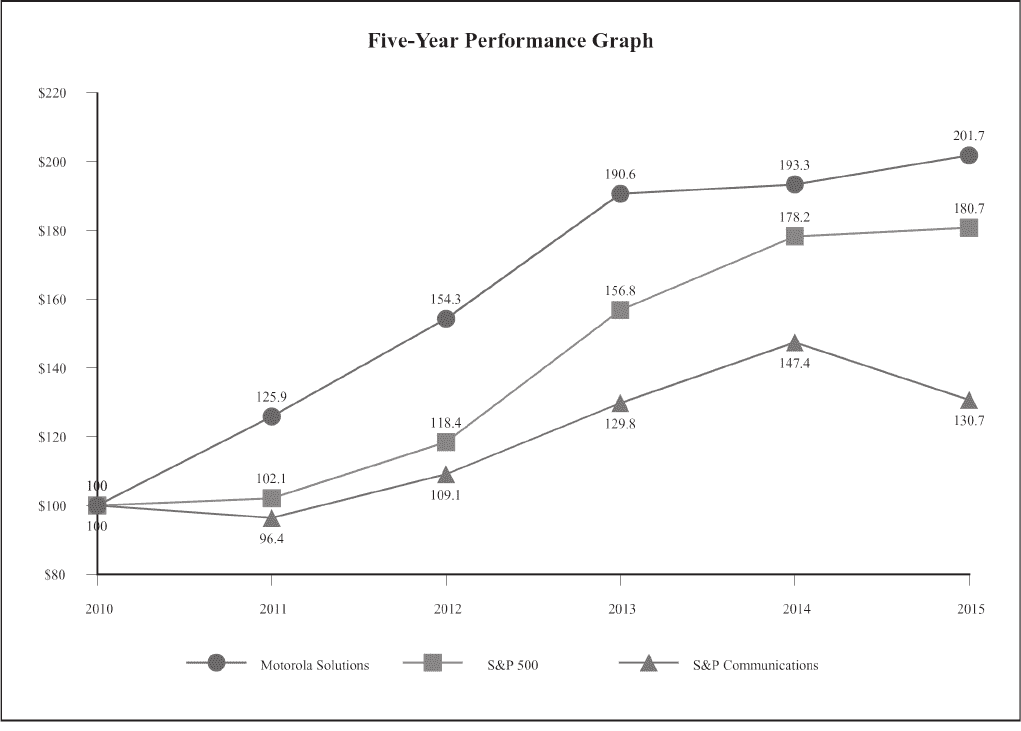
PERFORMANCE GRAPH
The following graph compares the five-year cumulative total returns of Motorola Solutions, Inc., the S&P 500 Index and the
S&P Communications Equipment Index.
This graph assumes $100 was invested in the stock or the indices on December 31, 2010 and reflects the payment of
dividends, including the Company's distribution to its shareholders of one share of Motorola Mobility for every eight shares of its
common stock on January 4, 2011. For purposes of this graph, the Motorola Mobility distribution is treated as a dividend of
$26.46 per share (post the 1-for-7 reverse stock split announced on the same day, January 4, 2011) paid at the close of
business January 4, 2011.