Motorola 2015 Annual Report Download - page 35
Download and view the complete annual report
Please find page 35 of the 2015 Motorola annual report below. You can navigate through the pages in the report by either clicking on the pages listed below, or by using the keyword search tool below to find specific information within the annual report.-
 1
1 -
2
-
3
-
4
-
5
-
6
-
7
-
8
-
9
-
10
-
11
-
12
-
13
-
14
-
15
-
16
-
17
-
18
-
19
-
20
-
21
-
22
-
23
-
24
-
 25
25 -
 26
26 -
 27
27 -
 28
28 -
 29
29 -
 30
30 -
 31
31 -
 32
32 -
 33
33 -
 34
34 -
 35
35 -
 36
36 -
 37
37 -
 38
38 -
 39
39 -
 40
40 -
 41
41 -
 42
42 -
 43
43 -
 44
44 -
 45
45 -
46
-
47
-
48
-
49
-
50
-
51
-
52
-
53
-
54
-
55
-
56
-
57
-
58
-
59
-
60
-
61
-
62
-
63
-
64
-
65
-
66
-
67
-
68
-
69
-
70
-
71
-
72
-
73
-
74
-
75
-
76
-
77
-
78
-
79
-
80
-
81
-
82
-
83
-
84
-
85
-
86
-
87
-
88
-
89
-
90
-
91
-
92
-
93
-
94
-
95
-
96
-
97
-
98
-
99
-
100
-
101
-
102
-
103
 |
 |

34
The segment had operating earnings of $704 million in 2015, compared to an operating loss of $667 million in 2014. The
increase in operating earnings in 2015 compared to 2014 was driven primarily by: (i) a decrease in Other charges as a result of
a $1.3 billion expense related to the 2014 settlement of a U.S. pension plan, (ii) lower SG&A expenditures as a result of cost
savings initiatives, including headcount reductions, the favorable impact of foreign exchange rates, and reduced pension
expenses, and (iii) lower R&D expenditures driven by cost savings initiatives and the favorable impact of foreign exchange rates.
Segment Results—2014 Compared to 2013
The segment's net sales decreased $302 million, or 7%, to $3.8 billion in 2014, as compared to $4.1 billion in 2013. The
decrease in the segment's net sales was primarily driven by: (i) decreases in devices and systems sales in North America and
AP, (ii) a decrease in devices sales Latin America, and (iii) a decrease in systems sales in EA and ME, partially offset by: (i) an
increase in devices sales in EA and ME and (ii) an increase in systems sales in Latin America. On a geographic basis, net sales
decreased in North America, AP, and Latin America and increased in ME and EA in 2014, compared to 2013. The segment's
backlog was $1.2 billion at December 31, 2014 and $1.1 billion at December 31, 2013.
Net sales in North America comprised a significant portion of the segment’s business, accounting for approximately 62% of
the segment’s net sales in 2014, down from 63% of the segment’s net sales in 2013.
The segment had an operating loss of $667 million in 2014, compared to operating earnings of $639 million in 2013. The
decrease in operating earnings in 2014 compared to 2013, was driven primarily by: (i) an increase in Other charges as a result
of a $1.3 billion expense related to the 2014 settlement of a U.S. pension plan and (ii) lower net sales, resulting in lower gross
margin, partially offset by lower SG&A and R&D expenditures as a result of cost savings actions taken to lower variable
compensation expenses.
Services Segment
The Services segment’s net sales represented 35% of our consolidated net sales in 2015 and 2014, compared to 34% in
2013.
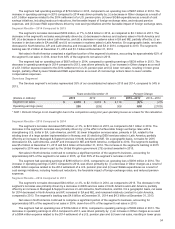
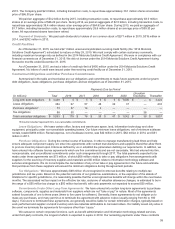
Years ended December 31 Percent Change
(Dollars in millions) 2015 2014 2013 2015—2014 2014—2013
Segment net sales $2,019$2,074$2,118 (3)% (2)%
Operating earnings (loss) 290 (339) 308 N/M (210)%
* N/M = Percent Change is not meaningful due to the comparison using prior year operating losses as a basis for the calculation.
Segment Results—2015 Compared to 2014
The segment’s net sales decreased $55 million, or 3%, to $2.0 billion in 2015, as compared to $2.1 billion in 2014. The
decrease in the segment's net sales was primarily driven by: (i) the effect of unfavorable foreign exchange rates with a
strengthening U.S. dollar in EA, Latin America, and AP, (ii) lower Integration services sales, primarily in EA, related to the
winding down of a large system implementation in Norway, and (iii) declining iDEN services sales in Latin America, partially
offset by an increase in Managed & Support services in North America and ME. On a geographic basis, net sales for 2015
decreased in EA, Latin America, and AP and increased in ME and North America, compared to 2014. The segment's backlog
was $5.2 billion at December 31, 2015 and $4.6 billion at December 31, 2014. The increase in the segment's backlog in 2015
compared to 2014 was driven in part by the United Kingdom government LTE contract awarded in 2015.
Net sales in North America continued to comprise a significant portion of the segment’s business, accounting for
approximately 62% of the segment’s net sales in 2015, up from 59% of the segment’s net sales in 2014.
The segment had operating earnings of $290 million in 2015, compared to an operating loss of $339 million in 2014. The
increase in operating earnings in 2015 compared to 2014, was driven primarily by: (i) a decrease in Other charges as a result of
a $584 million expense related to the 2014 settlement of a U.S. pension plan and (ii) lower SG&A expenditures as a result of
cost savings initiatives, including headcount reductions, the favorable impact of foreign exchange rates, and reduced pension
expenses.
Segment Results—2014 Compared to 2013
The segment's net sales decreased $44 million, or 2%, to $2.1 billion in 2014, as compared to 2013. The decrease in the
segment's net sales was primarily driven by a decrease in iDEN services sales in North America and Latin America, partially
offset by an increase in Managed & Support services in Latin America, North America, and EA. On a geographic basis, net sales
for 2014 decreased in North America and AP, increased in EA and ME, and remained relatively constant in Latin America,
compared to 2013. The segment's backlog was $4.6 billion at December 31, 2014 and $4.3 billion at December 31, 2013.
Net sales in North America continued to comprise a significant portion of the segment’s business, accounting for
approximately 59% of the segment’s net sales in 2014, down from 61% of the segment’s net sales in 2013.
The segment had an operating loss of $339 million in 2014, compared to operating earnings of $308 million in 2013. The
decrease in operating earnings in 2014 compared to 2013, was driven primarily by: (i) an increase in Other charges as a result
of a $584 million expense related to the 2014 settlement of a U.S. pension plan and (ii) lower net sales, resulting in lower gross