MasterCard 2015 Annual Report Download - page 89
Download and view the complete annual report
Please find page 89 of the 2015 MasterCard annual report below. You can navigate through the pages in the report by either clicking on the pages listed below, or by using the keyword search tool below to find specific information within the annual report.-
 1
1 -
2
-
3
-
4
-
5
-
6
-
7
-
8
-
9
-
10
-
11
-
12
-
13
-
14
-
15
-
16
-
17
-
18
-
19
-
20
-
21
-
22
-
23
-
24
-
25
-
26
-
27
-
28
-
29
-
30
-
31
-
32
-
33
-
34
-
35
-
36
-
37
-
38
-
39
-
40
-
41
-
42
-
43
-
44
-
45
-
46
-
47
-
48
-
49
-
50
-
51
-
52
-
53
-
54
-
55
-
56
-
57
-
58
-
59
-
60
-
61
-
62
-
63
-
64
-
65
-
66
-
67
-
68
-
69
-
70
-
71
-
72
-
73
-
74
-
75
-
76
-
77
-
78
-
 79
79 -
 80
80 -
 81
81 -
 82
82 -
 83
83 -
 84
84 -
 85
85 -
 86
86 -
 87
87 -
 88
88 -
 89
89 -
 90
90 -
 91
91 -
 92
92 -
 93
93 -
 94
94 -
 95
95 -
 96
96 -
 97
97 -
 98
98 -
 99
99 -
100
-
101
-
102
 |
 |

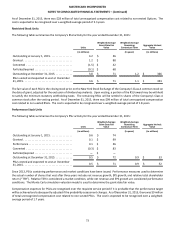
83
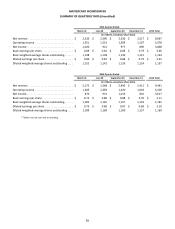
MASTERCARD INCORPORATED
SUMMARY OF QUARTERLY DATA (Unaudited)
2015 Quarter Ended
March 31 June 30 September 30 December 31 2015 Total
(in millions, except per share data)
Net revenue . . . . . . . . . . . . . . . . . . . . . . . . . . . . . . . . $ 2,230 $ 2,390 $ 2,530 $ 2,517 $ 9,667
Operating income . . . . . . . . . . . . . . . . . . . . . . . . . . . 1,351 1,251 1,369 1,107 5,078
Net income . . . . . . . . . . . . . . . . . . . . . . . . . . . . . . . . . 1,020 921 977 890 3,808
Basic earnings per share . . . . . . . . . . . . . . . . . . . . . . $ 0.89 $ 0.81 $ 0.86 $ 0.79 $ 3.36
Basic weighted-average shares outstanding . . . . . . 1,148 1,138 1,130 1,121 1,134
Diluted earnings per share . . . . . . . . . . . . . . . . . . . . $ 0.89 $ 0.81 $ 0.86 $ 0.79 $ 3.35
Diluted weighted-average shares outstanding . . . . 1,152 1,141 1,133 1,124 1,137
2014 Quarter Ended
March 31 June 30 September 30 December 31 2014 Total
(in millions, except per share data)
Net revenue . . . . . . . . . . . . . . . . . . . . . . . . . . . . . . . . $ 2,172 $ 2,368 $ 2,490 $ 2,411 $ 9,441
Operating income . . . . . . . . . . . . . . . . . . . . . . . . . . . 1,285 1,383 1,420 1,018 5,106
Net income . . . . . . . . . . . . . . . . . . . . . . . . . . . . . . . . . 870 931 1,015 801 3,617
Basic earnings per share . . . . . . . . . . . . . . . . . . . . . . $ 0.73 $ 0.80 $ 0.88 $ 0.70 $ 3.11
Basic weighted-average shares outstanding . . . . . . 1,185 1,165 1,157 1,153 1,165
Diluted earnings per share . . . . . . . . . . . . . . . . . . . . $ 0.73 $ 0.80 $ 0.87 $ 0.69 $ 3.10
Diluted weighted-average shares outstanding . . . . 1,189 1,169 1,160 1,157 1,169
* Tables may not sum due to rounding.