MasterCard 2015 Annual Report Download - page 68
Download and view the complete annual report
Please find page 68 of the 2015 MasterCard annual report below. You can navigate through the pages in the report by either clicking on the pages listed below, or by using the keyword search tool below to find specific information within the annual report.-
 1
1 -
2
-
3
-
4
-
5
-
6
-
7
-
8
-
9
-
10
-
11
-
12
-
13
-
14
-
15
-
16
-
17
-
18
-
19
-
20
-
21
-
22
-
23
-
24
-
25
-
26
-
27
-
28
-
29
-
30
-
31
-
32
-
33
-
34
-
35
-
36
-
37
-
38
-
39
-
40
-
41
-
42
-
43
-
44
-
45
-
46
-
47
-
48
-
49
-
50
-
51
-
52
-
53
-
54
-
55
-
56
-
57
-
 58
58 -
 59
59 -
 60
60 -
 61
61 -
 62
62 -
 63
63 -
 64
64 -
 65
65 -
 66
66 -
 67
67 -
 68
68 -
 69
69 -
 70
70 -
 71
71 -
 72
72 -
 73
73 -
 74
74 -
 75
75 -
 76
76 -
 77
77 -
 78
78 -
79
-
80
-
81
-
82
-
83
-
84
-
85
-
86
-
87
-
88
-
89
-
90
-
91
-
92
-
93
-
94
-
95
-
96
-
97
-
98
-
99
-
100
-
101
-
102
 |
 |

MASTERCARD INCORPORATED
NOTES TO CONSOLIDATED FINANCIAL STATEMENTS – (Continued)
62
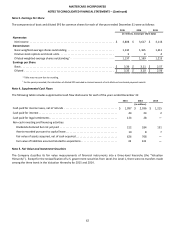
Note 3. Earnings Per Share
The components of basic and diluted EPS for common shares for each of the years ended December 31 were as follows:
2015 2014 2013
(in millions, except per share data)
Numerator:
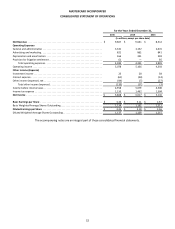
Net income . . . . . . . . . . . . . . . . . . . . . . . . . . . . . . . . . . . . . . . . . . . . . . . . . . . . . . . . . . . . $ 3,808 $ 3,617 $ 3,116
Denominator:
Basic weighted-average shares outstanding. . . . . . . . . . . . . . . . . . . . . . . . . . . . . . . . . . 1,134 1,165 1,211
Dilutive stock options and stock units . . . . . . . . . . . . . . . . . . . . . . . . . . . . . . . . . . . . . . . 3 4 4
Diluted weighted-average shares outstanding 1. . . . . . . . . . . . . . . . . . . . . . . . . . . . . . . . . . . . . . . 1,137 1,169 1,215
Earnings per Share
Basic . . . . . . . . . . . . . . . . . . . . . . . . . . . . . . . . . . . . . . . . . . . . . . . . . . . . . . . . . . . . . . . . . . $ 3.36 $ 3.11 $ 2.57
Diluted . . . . . . . . . . . . . . . . . . . . . . . . . . . . . . . . . . . . . . . . . . . . . . . . . . . . . . . . . . . . . . . . $ 3.35 $ 3.10 $ 2.56
* Table may not sum due to rounding.
1 For the years presented, the calculation of diluted EPS excluded a minimal amount of anti-dilutive share-based payment awards.
Note 4. Supplemental Cash Flows
The following table includes supplemental cash flow disclosures for each of the years ended December 31:
2015 2014 2013
(in millions)
Cash paid for income taxes, net of refunds . . . . . . . . . . . . . . . . . . . . . . . . . . . . . . . . . . . . . . $ 1,097 $ 2,036 $ 1,215
Cash paid for interest . . . . . . . . . . . . . . . . . . . . . . . . . . . . . . . . . . . . . . . . . . . . . . . . . . . . . . . . 44 24 2
Cash paid for legal settlements . . . . . . . . . . . . . . . . . . . . . . . . . . . . . . . . . . . . . . . . . . . . . . . . 124 28 —
Non-cash investing and financing activities:
Dividends declared but not yet paid . . . . . . . . . . . . . . . . . . . . . . . . . . . . . . . . . . . . . . . . . 212 184 131
Assets recorded pursuant to capital lease. . . . . . . . . . . . . . . . . . . . . . . . . . . . . . . . . . . . . 10 8 7
Fair value of assets acquired, net of cash acquired . . . . . . . . . . . . . . . . . . . . . . . . . . . . . . 626 768 —
Fair value of liabilities assumed related to acquisitions . . . . . . . . . . . . . . . . . . . . . . . . . . 42 141 —
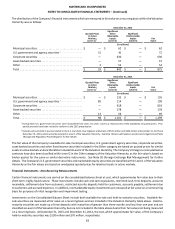
Note 5. Fair Value and Investment Securities
The Company classifies its fair value measurements of financial instruments into a three-level hierarchy (the “Valuation
Hierarchy”). Except for the reclassification of U.S. government securities from Level 2 to Level 1, there were no transfers made
among the three levels in the Valuation Hierarchy for 2015 and 2014.