MasterCard 2015 Annual Report Download - page 47
Download and view the complete annual report
Please find page 47 of the 2015 MasterCard annual report below. You can navigate through the pages in the report by either clicking on the pages listed below, or by using the keyword search tool below to find specific information within the annual report.-
 1
1 -
2
-
3
-
4
-
5
-
6
-
7
-
8
-
9
-
10
-
11
-
12
-
13
-
14
-
15
-
16
-
17
-
18
-
19
-
20
-
21
-
22
-
23
-
24
-
25
-
26
-
27
-
28
-
29
-
30
-
31
-
32
-
33
-
34
-
35
-
36
-
 37
37 -
 38
38 -
 39
39 -
 40
40 -
 41
41 -
 42
42 -
 43
43 -
 44
44 -
 45
45 -
 46
46 -
 47
47 -
 48
48 -
 49
49 -
 50
50 -
 51
51 -
 52
52 -
 53
53 -
 54
54 -
 55
55 -
 56
56 -
 57
57 -
58
-
59
-
60
-
61
-
62
-
63
-
64
-
65
-
66
-
67
-
68
-
69
-
70
-
71
-
72
-
73
-
74
-
75
-
76
-
77
-
78
-
79
-
80
-
81
-
82
-
83
-
84
-
85
-
86
-
87
-
88
-
89
-
90
-
91
-
92
-
93
-
94
-
95
-
96
-
97
-
98
-
99
-
100
-
101
-
102
 |
 |

41
reinvest the undistributed earnings associated with our foreign subsidiaries as of December 31, 2015 outside of the United States
(as disclosed in Note 17 (Income Taxes) to the consolidated financial statements included in Part II, Item 8), and our current plans
do not require repatriation of these earnings. If these earnings are needed for U.S operations or can no longer be permanently
reinvested outside of the United States, the Company would be subject to U.S. tax upon repatriation.
Our liquidity and access to capital could be negatively impacted by global credit market conditions. The Company guarantees
the settlement of many MasterCard, Cirrus and Maestro-branded transactions between our issuers and acquirers. See Note 19
(Settlement and Other Risk Management) to the consolidated financial statements in Part II, Item 8 for a description of these
guarantees. Historically, payments under these guarantees have not been significant; however, historical trends may not be an
indication of the future. The risk of loss on these guarantees is specific to individual customers, but may also be driven significantly
by regional or global economic conditions, including, but not limited to the health of the financial institutions in a country or
region.
Our liquidity and access to capital could also be negatively impacted by the outcome of any of the legal or regulatory proceedings
to which we are a party. See our risk factor in “Risk Factors - Legal and Regulatory Risks” in Part I, Item 1A and Note 18 (Legal
and Regulatory Proceedings) to the consolidated financial statements included in Part II, Item 8; and Part II, Item 7 (Business
Environment) for additional discussion of these and other risks facing our business.
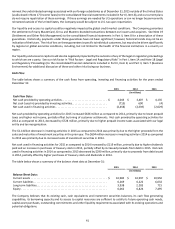
Cash Flow
The table below shows a summary of the cash flows from operating, investing and financing activities for the years ended
December 31:
2015 2014 2013
(in millions)
Cash Flow Data:
Net cash provided by operating activities . . . . . . . . . . . . . . . . . . . . . . . . . . . . . . . . $ 4,043 $ 3,407 $ 4,135
Net cash (used in) provided by investing activities. . . . . . . . . . . . . . . . . . . . . . . . . (715) 690 (4)
Net cash used in financing activities . . . . . . . . . . . . . . . . . . . . . . . . . . . . . . . . . . . . (2,458) (2,339) (2,629)
Net cash provided by operating activities for 2015 increased $636 million as compared to 2014, primarily due to lower prepaid
taxes and higher net income, partially offset by timing of customer settlements. Net cash provided by operating activities for
2014 as compared to 2013, decreased by $728 million, primarily due to higher prepaid income taxes associated with our legal
entity and tax reorganization.
The $1.4 billion decrease in investing activities in 2015 as compared to 2014 was primarily due to the higher proceeds from the
sales and maturities of investment securities in the prior year. The $694 million increase in investing activity in 2014 as compared
to 2013 was primarily due to increased sales of investment securities in 2014.
Net cash used in financing activities for 2015 as compared to 2014 increased by $119 million, primarily due to higher dividends
paid and an increase in purchases of treasury stock in 2015, partially offset by increased proceeds from debt in 2015. Net cash
used in financing activities in 2014 as compared to 2013 decreased by $290 million, primarily due to proceeds from debt issued
in 2014, partially offset by higher purchases of treasury stock and dividends in 2014.
The table below shows a summary of the balance sheet data at December 31:
2015 2014 2013
(in millions)
Balance Sheet Data:
Current assets . . . . . . . . . . . . . . . . . . . . . . . . . . . . . . . . . . . . . . . . . . . . . . . . . . . . . . $ 10,985 $ 10,997 $ 10,950
Current liabilities . . . . . . . . . . . . . . . . . . . . . . . . . . . . . . . . . . . . . . . . . . . . . . . . . . . . 6,269 6,222 6,032
Long-term liabilities. . . . . . . . . . . . . . . . . . . . . . . . . . . . . . . . . . . . . . . . . . . . . . . . . . 3,938 2,283 715
Equity . . . . . . . . . . . . . . . . . . . . . . . . . . . . . . . . . . . . . . . . . . . . . . . . . . . . . . . . . . . . . 6,062 6,824 7,495
The Company believes that its existing cash, cash equivalents and investment securities balances, its cash flow generating
capabilities, its borrowing capacity and its access to capital resources are sufficient to satisfy its future operating cash needs,
capital asset purchases, outstanding commitments and other liquidity requirements associated with its existing operations and
potential obligations.