MasterCard 2015 Annual Report Download - page 2
Download and view the complete annual report
Please find page 2 of the 2015 MasterCard annual report below. You can navigate through the pages in the report by either clicking on the pages listed below, or by using the keyword search tool below to find specific information within the annual report.-
 1
1 -
 2
2 -
 3
3 -
 4
4 -
 5
5 -
 6
6 -
 7
7 -
 8
8 -
 9
9 -
 10
10 -
 11
11 -
 12
12 -
 13
13 -
14
-
15
-
16
-
17
-
18
-
19
-
20
-
21
-
22
-
23
-
24
-
25
-
26
-
27
-
28
-
29
-
30
-
31
-
32
-
33
-
34
-
35
-
36
-
37
-
38
-
39
-
40
-
41
-
42
-
43
-
44
-
45
-
46
-
47
-
48
-
49
-
50
-
51
-
52
-
53
-
54
-
55
-
56
-
57
-
58
-
59
-
60
-
61
-
62
-
63
-
64
-
65
-
66
-
67
-
68
-
69
-
70
-
71
-
72
-
73
-
74
-
75
-
76
-
77
-
78
-
79
-
80
-
81
-
82
-
83
-
84
-
85
-
86
-
87
-
88
-
89
-
90
-
91
-
92
-
93
-
94
-
95
-
96
-
97
-
98
-
99
-
100
-
101
-
102
 |
 |

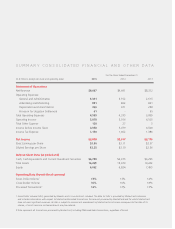
SUMMARY CONSOLIDATED FINANCIAL AND OTHER DATA
For the Years Ended December 31
(in $ millions, except per share and operating data) 2015 2014 2013
Statement of Operations
Net Revenue $9,667 $9,441 $8,312
Operating Expenses:
General and Administrative 3,341 3,152 2,615
Advertising and Marketing 821 862 841
Depreciation and Amortization 366 321 258
Provision for Litigation Settlement 61 - 95
Total Operating Expenses 4,589 4,335 3,809
Operating Income 5,078 5,106 4,503
Total Other Expense 120 27 3
Income before Income Taxes 4,958 5,079 4,500
Income Tax Expense 1,150 1,462 1,384
Net Income $3,808 $3,617 $3,116
Basic Earnings per Share $3.36 $3.11 $2.57
Diluted Earnings per Share $3.35 $3.10 $2.56
Balance Sheet Data (at period end)
Cash, Cash Equivalents and Current Investment Securities $6,738 $6,375 $6,295
Total Assets 16,269 15,329 14,242
Equity 6,062 6,824 7,495
Operating Data Growth (local currency)
Gross Dollar Volume1 13% 13% 14%
Cross-border Volume 16% 16% 18%
Processed Transactions2 12% 12% 13%
1 Gross Dollar Volume (GDV) generated by Maestro and Cirrus cards not included. The data for GDV is provided by MasterCard customers
and includes information with respect to MasterCard-branded transactions that are not processed by MasterCard and for which MasterCard
does not earn significant revenues. All data is subject to revision and amendment by MasterCard’s customers subsequent to the date of its
release, of which revisions and amendments may be material.
2 Data represents all transactions processed by MasterCard, including PIN-based debit transactions, regardless of brand.