MasterCard 2015 Annual Report Download - page 60
Download and view the complete annual report
Please find page 60 of the 2015 MasterCard annual report below. You can navigate through the pages in the report by either clicking on the pages listed below, or by using the keyword search tool below to find specific information within the annual report.-
 1
1 -
2
-
3
-
4
-
5
-
6
-
7
-
8
-
9
-
10
-
11
-
12
-
13
-
14
-
15
-
16
-
17
-
18
-
19
-
20
-
21
-
22
-
23
-
24
-
25
-
26
-
27
-
28
-
29
-
30
-
31
-
32
-
33
-
34
-
35
-
36
-
37
-
38
-
39
-
40
-
41
-
42
-
43
-
44
-
45
-
46
-
47
-
48
-
49
-
 50
50 -
 51
51 -
 52
52 -
 53
53 -
 54
54 -
 55
55 -
 56
56 -
 57
57 -
 58
58 -
 59
59 -
 60
60 -
 61
61 -
 62
62 -
 63
63 -
 64
64 -
 65
65 -
 66
66 -
 67
67 -
 68
68 -
 69
69 -
 70
70 -
71
-
72
-
73
-
74
-
75
-
76
-
77
-
78
-
79
-
80
-
81
-
82
-
83
-
84
-
85
-
86
-
87
-
88
-
89
-
90
-
91
-
92
-
93
-
94
-
95
-
96
-
97
-
98
-
99
-
100
-
101
-
102
 |
 |

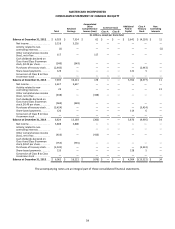
54
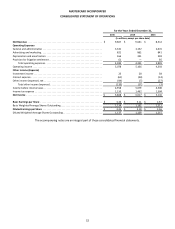
MASTERCARD INCORPORATED
CONSOLIDATED STATEMENT OF CHANGES IN EQUITY
Total
Retained
Earnings
Accumulated
Other
Comprehensive
Income (Loss)
Common Stock Additional
Paid-In
Capital
Class A
Treasury
Stock
Non-
Controlling
Interests
Class A Class B
(in millions, except per share data)
Balance at December 31, 2012 . . . $ 6,929 $ 7,354 $ 61 $ — $ — $ 3,641 $ (4,139) $ 12
Net income. . . . . . . . . . . . . . . . . 3,116 3,116 — — — — — —
Activity related to non-
controlling interests. . . . . . . . . . (1) — — — — — — (1)
Other comprehensive income
(loss), net of tax . . . . . . . . . . . . . 117 — 117 — — — — —
Cash dividends declared on
Class A and Class B common
stock, $0.29 per share . . . . . . . . (349) (349) — — — — — —
Purchases of treasury stock . . . (2,443) — — — — — (2,443) —
Share-based payments . . . . . . . 126 — — — — 121 5 —
Conversion of Class B to Class
A common stock . . . . . . . . . . . . — — ——— — — —
Balance at December 31, 2013 . . . 7,495 10,121 178 — — 3,762 (6,577) 11
Net income. . . . . . . . . . . . . . . . . 3,617 3,617 — — — — — —
Activity related to non-
controlling interests. . . . . . . . . . 23 — — — — — — 23
Other comprehensive income
(loss), net of tax . . . . . . . . . . . . . (438) — (438) — — — — —
Cash dividends declared on
Class A and Class B common
stock, $0.49 per share. . . . . . . . (569) (569) — — — — — —
Purchases of treasury stock . . . (3,424) — — — — — (3,424) —
Share-based payments . . . . . . . 120 — — — — 114 6 —
Conversion of Class B to Class
A common stock . . . . . . . . . . . . — — ——— — — —
Balance at December 31, 2014 . . . 6,824 13,169 (260) — — 3,876 (9,995) 34
Net income. . . . . . . . . . . . . . . . . 3,808 3,808 — — — — — —
Activity related to non-
controlling interests. . . . . . . . . . — — ——— — — —
Other comprehensive income
(loss), net of tax . . . . . . . . . . . . . (416) — (416) — — — — —
Cash dividends declared on
Class A and Class B common
stock, $0.67 per share. . . . . . . . (755) (755) — — — — — —
Purchases of treasury stock . . . (3,532) — — — — — (3,532) —
Share-based payments . . . . . . . 133 — — — — 128 5 —
Conversion of Class B to Class
A common stock . . . . . . . . . . . . — — ——— — — —
Balance at December 31, 2015 . . . $ 6,062 $ 16,222 $ (676) $ — $ — $ 4,004 $(13,522) $ 34
The accompanying notes are an integral part of these consolidated financial statements.