MasterCard 2015 Annual Report Download - page 38
Download and view the complete annual report
Please find page 38 of the 2015 MasterCard annual report below. You can navigate through the pages in the report by either clicking on the pages listed below, or by using the keyword search tool below to find specific information within the annual report.-
 1
1 -
2
-
3
-
4
-
5
-
6
-
7
-
8
-
9
-
10
-
11
-
12
-
13
-
14
-
15
-
16
-
17
-
18
-
19
-
20
-
21
-
22
-
23
-
24
-
25
-
26
-
27
-
 28
28 -
 29
29 -
 30
30 -
 31
31 -
 32
32 -
 33
33 -
 34
34 -
 35
35 -
 36
36 -
 37
37 -
 38
38 -
 39
39 -
 40
40 -
 41
41 -
 42
42 -
 43
43 -
 44
44 -
 45
45 -
 46
46 -
 47
47 -
 48
48 -
49
-
50
-
51
-
52
-
53
-
54
-
55
-
56
-
57
-
58
-
59
-
60
-
61
-
62
-
63
-
64
-
65
-
66
-
67
-
68
-
69
-
70
-
71
-
72
-
73
-
74
-
75
-
76
-
77
-
78
-
79
-
80
-
81
-
82
-
83
-
84
-
85
-
86
-
87
-
88
-
89
-
90
-
91
-
92
-
93
-
94
-
95
-
96
-
97
-
98
-
99
-
100
-
101
-
102
 |
 |

32
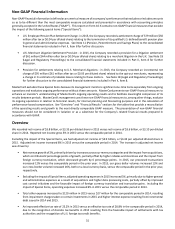
• The net impact of foreign currency translation, from the devaluation of the euro and the Brazilian real, decreased 2015
net income growth by $230 million or 7 percentage points.
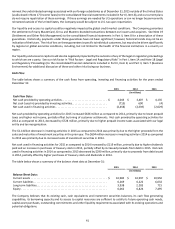
Other financial highlights for 2015 were as follows:
• We generated net cash flows from operations of $4.0 billion in 2015, compared to $3.4 billion in 2014.
• We acquired two businesses for $609 million, which focus on expanding our footprint and enhancing critical capabilities,
including in the area of data analytics with the acquisition of Applied Predictive Technologies.
• We completed a debt offering of €1.65 billion ($1.7 billion) and established a commercial paper program with
authorization to issue up to $3.75 billion in outstanding notes.
• We repurchased 38 million shares of our Class A common stock for $3.5 billion in 2015.
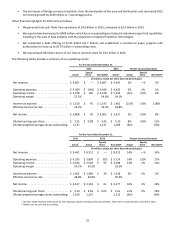
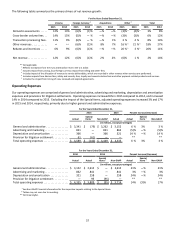
The following tables provide a summary of our operating results:
For the Years Ended December 31,
2015 2014 Percent Increase (Decrease)
Actual
Special
Items 1Non-GAAP Actual1Actual
Special
Items 1Non-GAAP
(in millions, except per share data and percentages)
Net revenue. . . . . . . . . . . . . . . . . . . . . . . . . . . . . $ 9,667 $ — $ 9,667 $ 9,441 2% —% 2%
Operating expenses. . . . . . . . . . . . . . . . . . . . . . . $ 4,589 $ (140) $ 4,449 $ 4,335 6% 3% 3%
Operating income . . . . . . . . . . . . . . . . . . . . . . . . $ 5,078 $ 140 $ 5,218 $ 5,106 (1)% (3)% 2%
Operating margin . . . . . . . . . . . . . . . . . . . . . . . . 52.5% 54.0% 54.1%
Income tax expense . . . . . . . . . . . . . . . . . . . . . . $ 1,150 $ 45 $ 1,195 $ 1,462 (21)% (3)% (18)%
Effective income tax rate . . . . . . . . . . . . . . . . . . 23.2% 23.4% 28.8%
Net income . . . . . . . . . . . . . . . . . . . . . . . . . . . . . $ 3,808 $ 95 $ 3,903 $ 3,617 5% (3)% 8%
Diluted earnings per share . . . . . . . . . . . . . . . . . $ 3.35 $ 0.08 $ 3.43 $ 3.10 8% (3)% 11%
Diluted weighted-average shares outstanding. 1,137 1,137 1,169 (3)% (3)%
For the Years Ended December 31,
2014 2013 Percent Increase (Decrease)
Actual1Actual
Special
Items 1Non-GAAP Actual
Special
Items 1Non-GAAP
(in millions, except per share data and percentages)
Net revenue. . . . . . . . . . . . . . . . . . . . . . . . . . . . . $ 9,441 $ 8,312 $ — $ 8,312 14% —% 14%
Operating expenses. . . . . . . . . . . . . . . . . . . . . . . $ 4,335 $ 3,809 $ (95) $ 3,714 14% (3)% 17%
Operating income . . . . . . . . . . . . . . . . . . . . . . . . $ 5,106 $ 4,503 $ 95 $ 4,598 13% 2% 11%
Operating margin . . . . . . . . . . . . . . . . . . . . . . . . 54.1% 54.2% 55.3%
Income tax expense . . . . . . . . . . . . . . . . . . . . . . $ 1,462 $ 1,384 $ 34 $ 1,418 6% 3% 3%
Effective income tax rate . . . . . . . . . . . . . . . . . . 28.8% 30.8% 30.9%
Net income . . . . . . . . . . . . . . . . . . . . . . . . . . . . . $ 3,617 $ 3,116 $ 61 $ 3,177 16% 2% 14%
Diluted earnings per share . . . . . . . . . . . . . . . . . $ 3.10 $ 2.56 $ 0.05 $ 2.61 21% 2% 19%
Diluted weighted-average shares outstanding. 1,169 1,215 1,215 (4)% (4)%
1 See Non-GAAP Financial Information for the respective impacts relating to the Special Items. There were no Special Items recorded in 2014.
* Tables may not sum due to rounding.