MasterCard 2015 Annual Report Download - page 46
Download and view the complete annual report
Please find page 46 of the 2015 MasterCard annual report below. You can navigate through the pages in the report by either clicking on the pages listed below, or by using the keyword search tool below to find specific information within the annual report.-
 1
1 -
2
-
3
-
4
-
5
-
6
-
7
-
8
-
9
-
10
-
11
-
12
-
13
-
14
-
15
-
16
-
17
-
18
-
19
-
20
-
21
-
22
-
23
-
24
-
25
-
26
-
27
-
28
-
29
-
30
-
31
-
32
-
33
-
34
-
35
-
 36
36 -
 37
37 -
 38
38 -
 39
39 -
 40
40 -
 41
41 -
 42
42 -
 43
43 -
 44
44 -
 45
45 -
 46
46 -
 47
47 -
 48
48 -
 49
49 -
 50
50 -
 51
51 -
 52
52 -
 53
53 -
 54
54 -
 55
55 -
 56
56 -
57
-
58
-
59
-
60
-
61
-
62
-
63
-
64
-
65
-
66
-
67
-
68
-
69
-
70
-
71
-
72
-
73
-
74
-
75
-
76
-
77
-
78
-
79
-
80
-
81
-
82
-
83
-
84
-
85
-
86
-
87
-
88
-
89
-
90
-
91
-
92
-
93
-
94
-
95
-
96
-
97
-
98
-
99
-
100
-
101
-
102
 |
 |

40
flexibility and efficiency with regard to the global deployment of cash, as well as ongoing benefits in our effective income tax
rate. See Note 17 (Income Taxes) to the consolidated financial statements included in Part II, Item 8 for further discussion.
The provision for income taxes differs from the amount of income tax determined by applying the U.S. federal statutory income
tax rate of 35% to pretax income for the years ended December 31, as a result of the following:
For the Years Ended December 31,
2015 2014 2013
Amount Percent Amount Percent Amount Percent
(in millions, except percentages)
Income before income taxes . . . . . . . . . . . . . . . . $ 4,958 $ 5,079 $ 4,500
Federal statutory tax. . . . . . . . . . . . . . . . . . . . . . . 1,735 35.0 % 1,778 35.0 % 1,575 35.0 %
State tax effect, net of federal benefit. . . . . . . . . 27 0.5 % 29 0.6 % 19 0.4 %
Foreign tax effect. . . . . . . . . . . . . . . . . . . . . . . . . . (144) (2.9)% (108) (2.1)% (208) (4.6)%
Foreign repatriation . . . . . . . . . . . . . . . . . . . . . . . (172) (3.5)% (177) (3.5)% (14) (0.3)%
Impact of settlements with tax authorities. . . . . (147) (2.9)% — — % — — %
Other foreign tax credits. . . . . . . . . . . . . . . . . . . . (109) (2.2)% (6) (0.1)% (3) — %
Other, net. . . . . . . . . . . . . . . . . . . . . . . . . . . . . . . . (40) (0.8)% (54) (1.1)% 15 0.3 %
Income tax expense . . . . . . . . . . . . . . . . . . . . . . . $ 1,150 23.2 % $ 1,462 28.8 % $ 1,384 30.8 %
The Company’s GAAP effective tax rates for 2015 and 2013 were affected by the tax benefits related to the Special Items as
previously discussed.
During 2015, the Company’s unrecognized tax benefits related to tax positions taken during the current and prior periods
decreased by $183 million. The decrease in the Company’s unrecognized tax benefits for 2015 was primarily due to settlements
with tax authorities in multiple jurisdictions. Further, the information gained related to these matters was considered in measuring
uncertain tax benefits recognized for the periods subsequent to the periods settled. As of December 31, 2015, the Company’s
unrecognized tax benefits related to positions taken during the current and prior period were $181 million, all of which would
reduce the Company’s effective tax rate if recognized. Within the next twelve months, we believe that the resolution of certain
federal, foreign and state and local tax examinations is reasonably possible and that a change in estimate, reducing unrecognized
tax benefits, may occur. It is not possible to provide a range of the potential change until the examinations progress further or
the related statute of limitations expire.
In 2010, in connection with the expansion of the Company’s operations in the Asia Pacific, Middle East and Africa region, the
Company’s subsidiary in Singapore, MasterCard Asia Pacific Pte. Ltd. (“MAPPL”), received an incentive grant from the Singapore
Ministry of Finance. See Note 17 (Income Taxes) to the consolidated financial statements included in Part II, Item 8 for further
discussion.
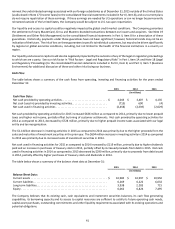
Liquidity and Capital Resources
We need liquidity and access to capital to fund our global operations, credit and settlement exposure, capital expenditures,
investments in our business and current and potential obligations. The Company generates the cash required to meet these
needs through operations. The following table summarizes the cash, cash equivalents, investments and credit available to the
Company at December 31:
2015 2014 2013
(in billions)
Cash, cash equivalents and investments 1. . . . . . . . . . . . . . . . . . . . . . . . . . . . . . . . . . . . . . . . . . . . . . . . $6.7$6.4$6.3
Unused line of credit 2. . . . . . . . . . . . . . . . . . . . . . . . . . . . . . . . . . . . . . . . . . . . . . . . . . . . . . 3.8 3.0 3.0
1 Investments include available-for-sale securities and held-to-maturity securities. At December 31, 2015, 2014 and 2013, this amount excludes restricted
cash related to the U.S. merchant class litigation settlement of $541 million, $540 million and $723 million, respectively.
2 Other than for business continuity planning, we did not use any funds from the line of credit during the periods presented.
Cash, cash equivalents and investments held by our foreign subsidiaries (i.e., any entities where earnings would be subject to
U.S. tax upon repatriation) was $3.3 billion and $2.6 billion at December 31, 2015 and 2014, respectively, or 48% and 42% as of
such dates. The decrease in cash, cash equivalents and investments held by our domestic subsidiaries during 2015 was primarily
driven by our use of cash in the U.S. to fund our share repurchases and dividend activity. It is our present intention to permanently