LG 2000 Annual Report Download - page 73
Download and view the complete annual report
Please find page 73 of the 2000 LG annual report below. You can navigate through the pages in the report by either clicking on the pages listed below, or by using the keyword search tool below to find specific information within the annual report.-
 1
1 -
2
-
3
-
4
-
5
-
6
-
7
-
8
-
9
-
10
-
11
-
12
-
13
-
14
-
15
-
16
-
17
-
18
-
19
-
20
-
21
-
22
-
23
-
24
-
25
-
26
-
27
-
28
-
29
-
30
-
31
-
32
-
33
-
34
-
35
-
36
-
37
-
38
-
39
-
40
-
41
-
42
-
43
-
44
-
45
-
46
-
47
-
48
-
49
-
50
-
51
-
52
-
53
-
54
-
55
-
56
-
57
-
58
-
59
-
60
-
61
-
62
-
 63
63 -
 64
64 -
 65
65 -
 66
66 -
 67
67 -
 68
68 -
 69
69 -
 70
70 -
 71
71 -
 72
72 -
 73
73 -
 74
74 -
 75
75 -
 76
76 -
 77
77 -
 78
78 -
 79
79 -
 80
80 -
 81
81 -
 82
82 -
 83
83
 |
 |

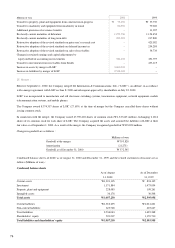
Main products each business division manufactures and sells are as follows :
Display division : TV, CPT/CDT, monitor, DY, FBT, electron gun, magnetron and PDP
Home appliances division : refrigerator, washing machine, air conditioner, microwave oven and vacuum cleaner
Multimedia division : VCR, PC, computer, CD-ROM and audio
Information & communications division : mobile telecommunication systems, mobile phones, electronic switching systems,
transmission equipment, network equipment
Financial Data by Business Division
Business Division
Home Information & Supporting
Millions of won Total Multimedia appliance Display communications division
Sales
External sales W14,835,674 W4,453,202 W3,881,806 W4,580,250 W1,075,726 W 844,690
Inter-division sales 279,463 37,634 13,125 127,245 6,429 95,030
15,115,137 4,490,836 3,894,931 4,707,495 1,082,155 939,720
Operating income (loss) 921,085 260,459 481,029 340,630 (75,923) (85,110)
Fixed assets
Property, plant &
equipment 3,337,088 450,877 782,751 946,522 348,518 808,420
Intangible assets 1,092,512 6,140 5,395 55,617 563,871 461,489
Total 4,429,600 457,017 788,146 1,002,139 912,389 1,269,909
Depreciation W 524,050 W 67,967 W 109,822 W 175,194 W 61,429 W 109,638
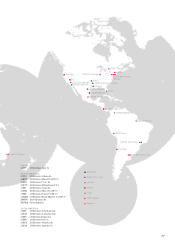
Financial Data by Geographic Area
Central &
North South Europe & Central
Millions of won Total Domestic America America CIS Asia Asia Oceania
External sales
W14,835,674 W4,881,185 W2,662,159 W472,826 W1,931,543 W779,659 W3,922,189 W186,113
Inter-division sales
279,463 279,463 – – – – – –
Sales
W15,115,137 W5,160,648 W2,662,159 W472,826 W1,931,543 W779,659 W3,922,189 W186,112
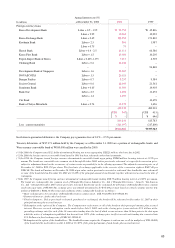
24. Supplemental Cash Flow Information :
The Company considers cash on hand, bank deposits and highly liquid marketable securities with original maturities of three months
or less to be cash and cash equivalents.
Significant transactions not affecting cash flows for the year ended December 31, 2000 and 1999 are as follows :
73