LG 2000 Annual Report Download - page 55
Download and view the complete annual report
Please find page 55 of the 2000 LG annual report below. You can navigate through the pages in the report by either clicking on the pages listed below, or by using the keyword search tool below to find specific information within the annual report.-
 1
1 -
2
-
3
-
4
-
5
-
6
-
7
-
8
-
9
-
10
-
11
-
12
-
13
-
14
-
15
-
16
-
17
-
18
-
19
-
20
-
21
-
22
-
23
-
24
-
25
-
26
-
27
-
28
-
29
-
30
-
31
-
32
-
33
-
34
-
35
-
36
-
37
-
38
-
39
-
40
-
41
-
42
-
43
-
44
-
 45
45 -
 46
46 -
 47
47 -
 48
48 -
 49
49 -
 50
50 -
 51
51 -
 52
52 -
 53
53 -
 54
54 -
 55
55 -
 56
56 -
 57
57 -
 58
58 -
 59
59 -
 60
60 -
 61
61 -
 62
62 -
 63
63 -
 64
64 -
 65
65 -
66
-
67
-
68
-
69
-
70
-
71
-
72
-
73
-
74
-
75
-
76
-
77
-
78
-
79
-
80
-
81
-
82
-
83
 |
 |

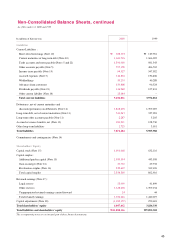
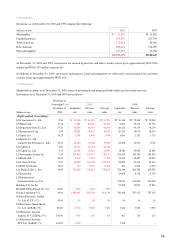
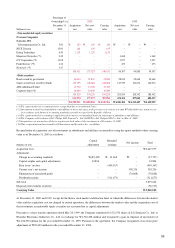
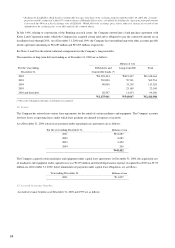
6. Inventories:
Inventories as of December 31, 2000 and 1999 comprise the following:
Millions of won 2000 1999
Merchandise W 33,517 W 15,582
Finished products 474,415 251,799
Work in process 172,231 85,983
Raw materials 406,664 122,099
Parts and supplies 105,052 74,984
W1,191,879 W550,447
At December 31, 2000 and 1999, inventories are insured against fire and other casualty losses up to approximately W652,806
million and W501,787 million, respectively.
In addition, at December 31, 2000, inventories and property, plant and equipment are collectively insured against fire and other
casualty losses up to approximately W872,563.
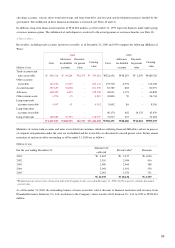
7. Investments :
Marketable securities as of December 31, 2000 consist of government and municipal bonds which are due within one year.
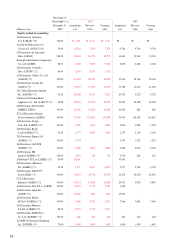
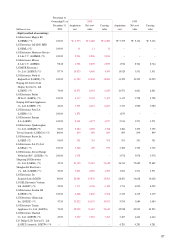
Investments as of December 31, 2000 and 1999 are as follows :
Percentage of
Ownership(%) at 2000 1999
December 31, Acquisition Net asset Carrying Acquisition Net asset Carrying
Millions of won 2000 cost value value cost value value
<Equity method of accounting>
LG Construction Co., Ltd. 8.56 W 35,148 W 61,091 W 61,091 W 35,148 W 70,244 W 70,244
LG Micron Ltd. 17.24 5,000 29,040 29,040 5,000 35,375 35,375
LG Department Store Co., Ltd. 57.70 72,706 46,933 46,933 66,012 44,179 44,179
LG International Corp. 2.94 20,253 18,527 18,527 20,253 18,074 18,074
LG Sports Ltd. 39.25 2,204 1,949 1,949 1,896 1,715 1,715
LG Innotek Co., Ltd.
(formerly, LG Precision Co., Ltd.) 53.41 31,135 79,062 79,062 24,592 72,571 72,57
LG Cable Ltd. 5.96 29,313 52,724 52,724 – – –
LG Capital Co., Ltd. 6.17 24,651 54,810 54,810 18,482 29,085 29,085
LG Investments Security Inc. 7.15 262,432 170,177 170,177 233,833 194,359 194,359
LG Hitachi Ltd. 49.00 6,060 7,275 7,275 12,150 18,487 18,487
LG-Caltex Oil Corp. 3.07 50,004 102,350 102,350 50,004 95,314 95,314
LG-EDS Systems Inc. 10.00 360 6,469 6,469 360 4,605 4,605
LG. Philips LCD Co., Ltd. 50.00 726,169 759,815 759,815 726,169 692,782 692,782
LG Internet Inc. – – – – 29,988 8,170 8,170
LG Information &
Communications Co., Ltd. – – – – 352,013 413,402 413,402
Kukdong City Gas Inc. – – – – 17,088 12,823 12,823
Hitachi/LG Data Storage Inc. (*2) 49.00 7,684 7,684 7,684
Dacom Corporation (*3) 49.06 1,299,943 991,139 991,139 746,669 787,312 787,312
Goldstar Electronics Tailand
Co., Ltd. (G.S.T.) (*2) 49.00 36 36 36 36 36 36
LG Electronics Almaty Kazak
Co., Ltd. (LGEAK) (*3) 100.00 3,746 3,584 3,584 3,746 3,965 3,965
LG Electronics Antwerp
Logistics N.V. (LGEAL) (*3) 100.00 967 315 315 967 115 115
LG Electronics Australia
PTY, Ltd. (LGEAP) (*1) 100.00 1,558 – – 1,558 – –
55