LG 2000 Annual Report Download - page 72
Download and view the complete annual report
Please find page 72 of the 2000 LG annual report below. You can navigate through the pages in the report by either clicking on the pages listed below, or by using the keyword search tool below to find specific information within the annual report.-
 1
1 -
2
-
3
-
4
-
5
-
6
-
7
-
8
-
9
-
10
-
11
-
12
-
13
-
14
-
15
-
16
-
17
-
18
-
19
-
20
-
21
-
22
-
23
-
24
-
25
-
26
-
27
-
28
-
29
-
30
-
31
-
32
-
33
-
34
-
35
-
36
-
37
-
38
-
39
-
40
-
41
-
42
-
43
-
44
-
45
-
46
-
47
-
48
-
49
-
50
-
51
-
52
-
53
-
54
-
55
-
56
-
57
-
58
-
59
-
60
-
61
-
 62
62 -
 63
63 -
 64
64 -
 65
65 -
 66
66 -
 67
67 -
 68
68 -
 69
69 -
 70
70 -
 71
71 -
 72
72 -
 73
73 -
 74
74 -
 75
75 -
 76
76 -
 77
77 -
 78
78 -
 79
79 -
 80
80 -
 81
81 -
 82
82 -
83
 |
 |

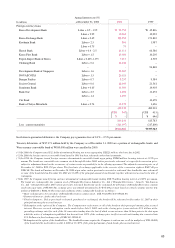
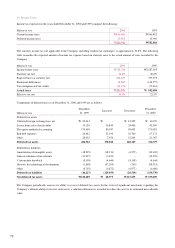
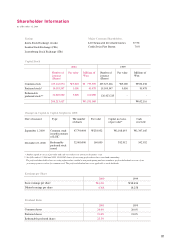
21. Dividends:
Details of dividends for the years ended December 31, 2000 and 1999 are as follows :
Dividends
2000 1999
Dividend Dividend Dividend Dividends
Millions of won ratio (%) amount ratio (%) amount
Common shares 20.0% W125,389 20% W107,328
Preferred shares 21.0% 18,466 21% 20,050
Redeemable preferred stock 25.5% 1,006 – –
W144,861 W127,378
Dividend Payout Ratio
Millions of won 2000 1999
Total dividends (A) W 144,861 W 127,378
Net income (B) 502,183 2,005,021
Dividend payout ratio ((A)/(B)) 28.85% 6.35%
Dividend Yield Ratio
2000 1999
Common Preferred Common Preferred
In won shares shares shares shares
Dividend per share (A) W 1,000 W1,050 W 1,000 W 1,050
Market price as of balance sheet date (B) W11,950 W6,310 W47,000 W25,060
Dividend yield ratio ((A)/(B)) 8.37% 16.64% 2.13% 4.19%
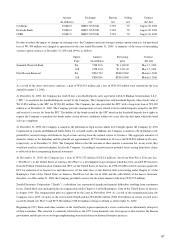
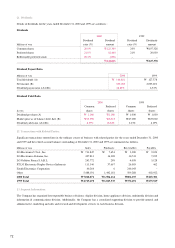
22. Transactions with Related Parties:
Significant transactions entered into in the ordinary course of business with related parties for the years ended December 31, 2000
and 1999 and the related account balances outstanding at December 31, 2000 and 1999 are summarized as follows.
Millions of won Sales Purchases Receivables Payables
LG Electronics U.S.A., Inc. W 711,847 W 7,654 W 3,900 W 9,674
LG Electronics Alabama, Inc. 427,811 16,308 16,741 7,195
LG Goldstar France S.A.R.L. 243,772 298 4,098 5,128
PT LG Electronics Display Devices Indonesia 111,146 37,667 26,085 462
Zenith Electronics Corporation 46,264 6 246,043 –
Other 5,488,031 1,442,181 509,288 402,922
2000 Total W7,028,871 W1,504,114 W806,155 W425,381
1999 Total W4,725,470 W1,049,335 W372,491 W275,529
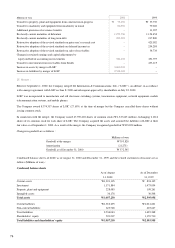
23. Segment Information:
The Company has organized four reportable business divisions: display division, home appliances division, multimedia division and
information & communications division. Additionally, the Company has a centralized supporting division to provide general and
administrative, marketing and sales and research and development services to each business division.
72