LG 2000 Annual Report Download - page 38
Download and view the complete annual report
Please find page 38 of the 2000 LG annual report below. You can navigate through the pages in the report by either clicking on the pages listed below, or by using the keyword search tool below to find specific information within the annual report.-
 1
1 -
2
-
3
-
4
-
5
-
6
-
7
-
8
-
9
-
10
-
11
-
12
-
13
-
14
-
15
-
16
-
17
-
18
-
19
-
20
-
21
-
22
-
23
-
24
-
25
-
26
-
27
-
 28
28 -
 29
29 -
 30
30 -
 31
31 -
 32
32 -
 33
33 -
 34
34 -
 35
35 -
 36
36 -
 37
37 -
 38
38 -
 39
39 -
 40
40 -
 41
41 -
 42
42 -
 43
43 -
 44
44 -
 45
45 -
 46
46 -
 47
47 -
 48
48 -
49
-
50
-
51
-
52
-
53
-
54
-
55
-
56
-
57
-
58
-
59
-
60
-
61
-
62
-
63
-
64
-
65
-
66
-
67
-
68
-
69
-
70
-
71
-
72
-
73
-
74
-
75
-
76
-
77
-
78
-
79
-
80
-
81
-
82
-
83
 |
 |

1999
481
550
2,726
4,120
1,215
9,092
2000
800
1,192
3,337
4,211
2,340
11,880
Assets
Trade accounts & notes receivable
Inventories
Property, plant & equipment
Investment
Other
1998
634
441
2,826
2,564
2,245
8,710
In billions of Korean won
2000
729
1,445
502
4,431
4,430
4,368
4,367
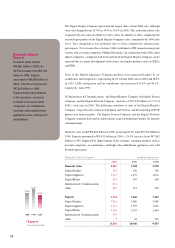
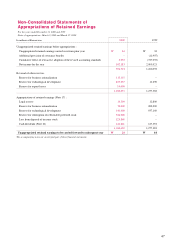
Profitability
Income (In billions of Korean won)
Ordinary Income
EBITDA
Net Income
Per Share (In Korean won)
Basic earnings
Basic ordinary income
Diluted earnings
Diluted ordinary income
1999
2,588
1,055
2,005
18,494
18,494
18,258
18,258
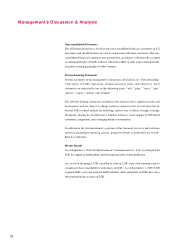
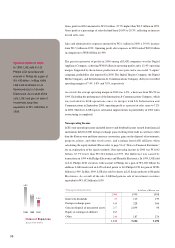
In spite of the setback of overall profitability, LGE sustained its profitability throughout
2000. Excluding asset sales in 1999, ROA improved from 3.7% in 1999 to 4.9% in 2000
while ROE declined from 19.4% to 18.2%, reflecting 2000 capital increases.
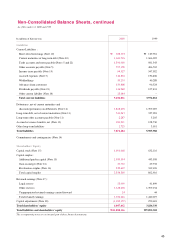
Financial Position
Total Assets
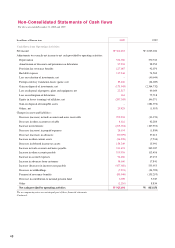
LGE's total assets in 2000 were W11.9 trillion, a 30.7% increase from 1999. Not
accounting for the W1.3 trillion in assets generated through the merger of LGIC, total
assets increased by 15.8%. The most noticeable change in the structure of assets in 2000
was an increase of intangible assets from W106 billion in 1999 to W1.1 trillion in 2000.
Such tangible assets included goodwill of W375 billion and industrial property rights of
W559 billion.
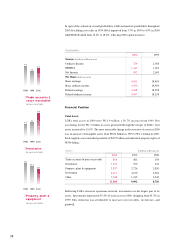
Reflecting LGE's extensive operations network, investments are the largest part of its
assets. Investments represented 35.4% of total assets in 2000, dropping from 45.3% in
1999. This reduction was attributable to increases of receivables, inventories, and
g o o d w i l l .
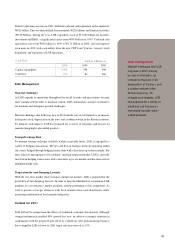
6.4
4.6
5.4
Trade accounts &
notes receivables
1998 1999 2000
As a percent of sales
28.7
25.8
22.5
Property, plant &
equipment
1998 1999 2000
As a percent of sales
4.5 5.2
8.0
Inventories
1998 1999 2000
As a percent of sales
38