LG 2000 Annual Report Download - page 5
Download and view the complete annual report
Please find page 5 of the 2000 LG annual report below. You can navigate through the pages in the report by either clicking on the pages listed below, or by using the keyword search tool below to find specific information within the annual report.-
 1
1 -
 2
2 -
 3
3 -
 4
4 -
 5
5 -
 6
6 -
 7
7 -
 8
8 -
 9
9 -
 10
10 -
 11
11 -
 12
12 -
 13
13 -
 14
14 -
 15
15 -
 16
16 -
17
-
18
-
19
-
20
-
21
-
22
-
23
-
24
-
25
-
26
-
27
-
28
-
29
-
30
-
31
-
32
-
33
-
34
-
35
-
36
-
37
-
38
-
39
-
40
-
41
-
42
-
43
-
44
-
45
-
46
-
47
-
48
-
49
-
50
-
51
-
52
-
53
-
54
-
55
-
56
-
57
-
58
-
59
-
60
-
61
-
62
-
63
-
64
-
65
-
66
-
67
-
68
-
69
-
70
-
71
-
72
-
73
-
74
-
75
-
76
-
77
-
78
-
79
-
80
-
81
-
82
-
83
 |
 |

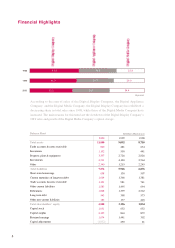
9,853
10,546
14,836
Sales
1998 1999 2000
LGE’s total sales in 2000
amounted to W14,836 billion,
increases of 40.7% and
50.6% from 1999 and 1998,
respectively.
1998 1999 2000
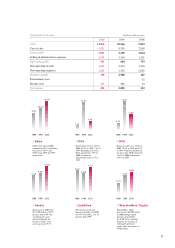
1.3%
22.5%
4.8%
79.9%
14.0%
ROA
1998 1999 2000
Return on assets was 4.8% in
2000, 22.5% in 1999, 1.3% in
1998. Excluding asset sales,
ROA amounted to 4.9% in
2000, a significant
improvement from 3.7% in
1999.
ROE
Return on equity was 14.0% in
2000, 79.9% in 1999 and 6.7%
in 1998. Without consideration
for asset sales, ROE lowered to
18.2% in 2000, following an
19.4% in 1999.
8,710 9,092
11,880
6,876
5,906
7,872
1,834
3,186
4,008
Assets
1998 1999 2000
Total assets in 2000 were
W11,880 billion, a 30.7%
increase from 1999. Not
accounting for assets
generated through the
merger of LGIC, total
assets increased 15.8%.
Liabilities
The total of current and
long-term liabilities in 2000
was W7,872 billion, a 33.3%
increase from 1999.
Shareholders’ Equity
1998 1999 2000
Shareholders’ equity
increased to W4,008 billion
in 2000 through capital
increases generated by
the LGIC share exchange
program, the issuance of
redeemable preferred
stocks, and a net income of
W502 billion.
1998 1999 2000
Statements of Income
Sales
Cost of sales
Gross profit
Selling & administrative expenses
Operating profit
Non-operating income
Non-operating expenses
Ordinary profit
Extraordinary loss
Income taxes
Net income
1998
9,853
7,809
2,044
1,291
753
1,496
2,082
167
12
43
112
1999
10,546
8,356
2,190
1,506
684
3,224
1,320
2,588
-
583
2,005
2000
14,836
11,821
3,015
2,094
921
1,042
1,234
729
-
227
502
In billions of Korean won
6.7%
5