LG 2000 Annual Report Download - page 49
Download and view the complete annual report
Please find page 49 of the 2000 LG annual report below. You can navigate through the pages in the report by either clicking on the pages listed below, or by using the keyword search tool below to find specific information within the annual report.-
 1
1 -
2
-
3
-
4
-
5
-
6
-
7
-
8
-
9
-
10
-
11
-
12
-
13
-
14
-
15
-
16
-
17
-
18
-
19
-
20
-
21
-
22
-
23
-
24
-
25
-
26
-
27
-
28
-
29
-
30
-
31
-
32
-
33
-
34
-
35
-
36
-
37
-
38
-
 39
39 -
 40
40 -
 41
41 -
 42
42 -
 43
43 -
 44
44 -
 45
45 -
 46
46 -
 47
47 -
 48
48 -
 49
49 -
 50
50 -
 51
51 -
 52
52 -
 53
53 -
 54
54 -
 55
55 -
 56
56 -
 57
57 -
 58
58 -
 59
59 -
60
-
61
-
62
-
63
-
64
-
65
-
66
-
67
-
68
-
69
-
70
-
71
-
72
-
73
-
74
-
75
-
76
-
77
-
78
-
79
-
80
-
81
-
82
-
83
 |
 |

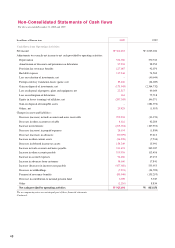
In millions of Korean won 2000 1999
Cash flows from Investing Activities :
Decrease in short-term financial instruments W 7,152 W 162,820
Proceeds from disposal of marketable securities 453 6,640
Proceeds from disposal of investments 576,897 3,124,663
Proceeds from disposal of property, plant and equipment 26,887 67,738
Proceeds from disposal of intangible assets –288,000
Decrease in long-term financial instruments 19,796 90,170
Decrease in long-term other accounts receivable 54,766 –
Decrease (increase) in refundable deposits 122,232 (4,560)
Increase in long-term financial instruments (2,752) (40,467)
Increase in severance insurance deposits (6,249) (86,300)
Acquisition of marketable securities (7) (10,371)
Acquisition of investments (282,127) (2,216,799)
Acquisition of property, plant and equipment (755,821) (422,424)
Acquisition of intangible assets (98,250) (36,600)
Decrease (increase) in short and long-term loans (73,123) 11,921
Increase in cash by merger 178,700 –
Others 2,601 1,297
Net cash provided by (used in) investing activities (228,845) 935,728
Cash Flows from Financing Activities :
Decrease in short-term borrowings (677,062) (377,167)
Increase in debentures 1,100,672 153,758
Increase in long-term debt 296,843 83,493
Payment of current maturities of long-term debt (1,485,652) (1,386,056)
Payment of debentures (20,704) (299,230)
Payment of long-term debt –(16,577)
Payment of dividends (127,349) (13,512)
Proceeds from disposal of treasury stock 136,400 –
Acquisition of treasury stock (377,859) –
Issuance of redeemable preferred stock 542,952 –
Other (26) (5,988)
Net cash used in financing activities (611,785) (1,861,279)
Increase (Decrease) in Cash and Cash Equivalents 84,864 (42,397)
Cash at Beginning of the Year (Note 24) 85,965 128,362
Cash at End of the Year (Note 24) W 170,829 W 85,965
The accompanying notes are an integral part of these financial statements
49
Non-Consolidated Statements of Cash flows, continued
For the years ended December 31, 2000 and 1999