LG 2000 Annual Report Download - page 35
Download and view the complete annual report
Please find page 35 of the 2000 LG annual report below. You can navigate through the pages in the report by either clicking on the pages listed below, or by using the keyword search tool below to find specific information within the annual report.-
 1
1 -
2
-
3
-
4
-
5
-
6
-
7
-
8
-
9
-
10
-
11
-
12
-
13
-
14
-
15
-
16
-
17
-
18
-
19
-
20
-
21
-
22
-
23
-
24
-
 25
25 -
 26
26 -
 27
27 -
 28
28 -
 29
29 -
 30
30 -
 31
31 -
 32
32 -
 33
33 -
 34
34 -
 35
35 -
 36
36 -
 37
37 -
 38
38 -
 39
39 -
 40
40 -
 41
41 -
 42
42 -
 43
43 -
 44
44 -
 45
45 -
46
-
47
-
48
-
49
-
50
-
51
-
52
-
53
-
54
-
55
-
56
-
57
-
58
-
59
-
60
-
61
-
62
-
63
-
64
-
65
-
66
-
67
-
68
-
69
-
70
-
71
-
72
-
73
-
74
-
75
-
76
-
77
-
78
-
79
-
80
-
81
-
82
-
83
 |
 |

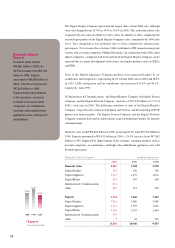
Domestic sales represented 32.9% of total sales in 2000, increasing from 25.6% in 1999.
Although there was high growth in exports during the year, its share of total annual sales
decreased from 74.4% in 1999 to 67.1%. The Digital Media Company expanded its
proportion of total sales in both domestic sales and exports while the Digital Display
Company and Digital Appliance Company experienced decreased shares in domestic
sales and exports. The Digital Media Company's domestic sales and exports increased
from 5.6% and 22.4% of total sales in 1999 to 6.2% and 23.8% in 2000, respectively.
From a geographical perspective, sales in 2000 grew in all regions, particularly Europe
and Asia. Exports were strongly backed by LGE's efforts for market diversification.
Exports to Asia were US$3.6 billion, representing the largest share of total sales at 43.8%.
Air conditioner and refrigerator sales to Southeast Asia were a main factor for its
dominance. Exports to Europe and the CIS had the fastest growth rates, equaling US$1.6
billion in 2000, a rise of 36.2% from US$1.1 billion in 1999. The sharp rise in Europe was
prompted by optical storage products and selective home appliances. North America
recorded a 15.0% sales increase as a result of successful marketing techniques and a
nationwide economic boom. In the future, LGE will increase its North American sales
with the Zenith brand, high-value-added consumer products such as flat-wide screen TVs,
DVDs, and mobile internet phones. Exports to Central and South America grew
substantially through LGE's strong marketing activities in Brazil, Peru, and Chile.
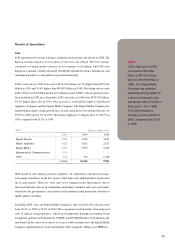
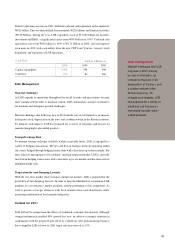
Sales Costs
Sales costs for 2000 increased 41.5% to W11,821 billion from W8,356 billion in 1999,
primarily due to the merger and increases in R&D expenses.
Materials representing 70% of total sales costs increased from W5.6 trillion in 1999 to
W8.3 trillion in 2000. The increase was well over the average increase of each item's cost
in 2000. Total R&D expenses, the sum of R&D expenses in sales costs, and sales and
administrative expenses rose 68.3% to W706 billion in 2000, compared with W419
billion in 1999. Major R&D expenses were the result of the Digital Display Company
products such as PDPs, PCBs, flat monitors, and IMT 2000-related systems and products.
1999
2,023
319
1,148
1,784
1,017
298
6,589
2000
2,326
470
1,564
2,106
1,526
298
8,290
Exports by Area
North America
Central & South America
Europe & CIS
Asia(excluding China)
China
Oceania & Africa
1998
1,198
657
1,051
1,373
773
275
5,327
In millions of US dollars
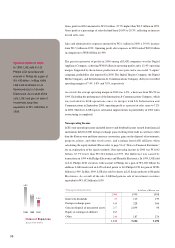
2,044 2,190
3,015
20.7% 20.8% 20.3%
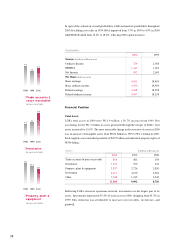
Gross Profit
Gross margin
1998 1999 2000
In billions of Korean won
7.4%
12.4%
5.8%
-7.1%
Operating Margin
Display Appliance Media Information
&
Communications
35
FOB Standard
When annualized, Information &
Communication Companies had a
positive 7.0% operating margin in 2000.