LG 2000 Annual Report Download - page 39
Download and view the complete annual report
Please find page 39 of the 2000 LG annual report below. You can navigate through the pages in the report by either clicking on the pages listed below, or by using the keyword search tool below to find specific information within the annual report.-
 1
1 -
2
-
3
-
4
-
5
-
6
-
7
-
8
-
9
-
10
-
11
-
12
-
13
-
14
-
15
-
16
-
17
-
18
-
19
-
20
-
21
-
22
-
23
-
24
-
25
-
26
-
27
-
28
-
 29
29 -
 30
30 -
 31
31 -
 32
32 -
 33
33 -
 34
34 -
 35
35 -
 36
36 -
 37
37 -
 38
38 -
 39
39 -
 40
40 -
 41
41 -
 42
42 -
 43
43 -
 44
44 -
 45
45 -
 46
46 -
 47
47 -
 48
48 -
 49
49 -
50
-
51
-
52
-
53
-
54
-
55
-
56
-
57
-
58
-
59
-
60
-
61
-
62
-
63
-
64
-
65
-
66
-
67
-
68
-
69
-
70
-
71
-
72
-
73
-
74
-
75
-
76
-
77
-
78
-
79
-
80
-
81
-
82
-
83
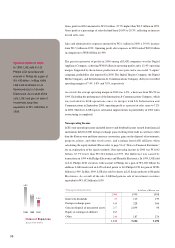
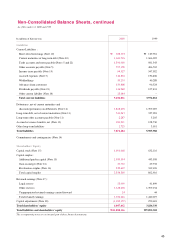
 |
 |

1999
130
1,366
981
1,495
3,972
1,399
398
137
1,934
5,906
2000
658
1,664
1,391
1,583
5,296
1,848
543
185
2,576
7,872
Liabilities
Short-term borrowings
Current maturities of long-term debt
Trade accounts & notes payable
Other current liabilities
Debentures
Long-term debt
Other noncurrent liabilities
1998
507
1,381
741
694
3,323
2,562
573
418
3,553
6,876
In billions of Korean won
Trade accounts & notes receivable increased from W481 billion to W800 billion. Based
on average receivables, net sales to receivables turnover improved from 19 times in 1999
to 23 times in 2000, despite high growth in sales. This improvement was in response to
the diversity of LGE's receivables collection policies and its efforts to secure proper
liquidity from its ordinary operations. Inventories doubled from W550 billion to W1,192
billion, comprised of LGIC inventories amounting to W373 billion, ready-manufactured
air conditioners worth W105 billion, and IT-related inventories totaling W99 billion.
Inventory turnover (the ratio of the cost of goods sold to average inventory) dropped to 17
times in 2000 while overall fixed assets efficiency improved. To maintain adequate
inventory levels, LGE is doing its utmost to reduce procurement and manufacturing lead-
time and restructure its logistics network.
Regarding the composition of the W4.2 trillion in investments in 2000, W760 billion was
due to equity investment in LG. Philips LCD, W991 billion resulted from equity
investment in Dacom, and W149 billion was due to investment in senior secured notes
issued by Zenith.
F u n d i n g
The total of current and long-term liabilities in 2000 was W7,872 billion in 2000, 33.3%
higher than W5,906 billion in 1999. Mirroring the results of 1999, current liabilities and
long-term liabilities represented 67.3% and 32.7% of total liabilities, respectively.
With regard to current liabilities, trade accounts & notes payable increased from W981
billion to W1,391 billion. This increase was largely the result of an additional W278
billion from the LGIC merger and a W173 billion rise in foreign currency payables.
Foreign currency payables increased due to a boost in sales of products that are highly
dependent upon overseas materials such as PCs, CD-ROM drives, monitors, CRTs, and
air conditioners.
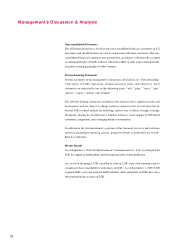
Investments
Reflecting LGE's extensive
operations network,
investments are the largest
part of its assets.
Investments represented
35.4% of total assets in
2000, dropping from 45.3%
in 1999. This reduction was
attributable to increases of
receivables, inventories, and
g o o d w i l l .
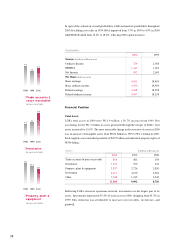
5,023
3,293
4,713
Debt
1998 1999 2000
In billions of Korean won
39