LG 2000 Annual Report Download - page 36
Download and view the complete annual report
Please find page 36 of the 2000 LG annual report below. You can navigate through the pages in the report by either clicking on the pages listed below, or by using the keyword search tool below to find specific information within the annual report.-
 1
1 -
2
-
3
-
4
-
5
-
6
-
7
-
8
-
9
-
10
-
11
-
12
-
13
-
14
-
15
-
16
-
17
-
18
-
19
-
20
-
21
-
22
-
23
-
24
-
25
-
 26
26 -
 27
27 -
 28
28 -
 29
29 -
 30
30 -
 31
31 -
 32
32 -
 33
33 -
 34
34 -
 35
35 -
 36
36 -
 37
37 -
 38
38 -
 39
39 -
 40
40 -
 41
41 -
 42
42 -
 43
43 -
 44
44 -
 45
45 -
 46
46 -
47
-
48
-
49
-
50
-
51
-
52
-
53
-
54
-
55
-
56
-
57
-
58
-
59
-
60
-
61
-
62
-
63
-
64
-
65
-
66
-
67
-
68
-
69
-
70
-
71
-
72
-
73
-
74
-
75
-
76
-
77
-
78
-
79
-
80
-
81
-
82
-
83
 |
 |

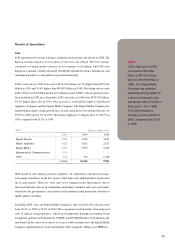
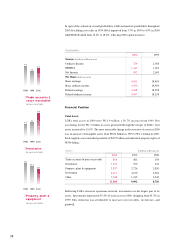
Gross profit in 2000 amounted to W3.0 trillion, 37.7% higher than W2.2 trillion in 1999.
Gross profit as a percentage of sales declined from 20.8% to 20.3%, reflecting an increase
in total sales costs.
Sales and administrative expenses amounted to W2.1 trillion in 2000, a 39.0% increase
from W1.5 trillion in 1999. Operating profit after expenses in 2000 totaled W921 billion
in comparison to W684 billion in 1999.
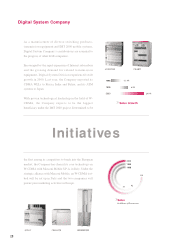
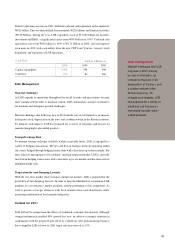
The greatest generator of profits in 2000 among all LGE companies was the Digital
Appliance Company, achieving W481 billion in operating profits and a 12.4% operating
margin. Supported by the in-house production of core parts and a successful "6 sigma"
campaign, profitability also improved in 2000. The Digital Display Company, the Digital
Media Company, and the Information & Communications Company (full year) recorded
operating margins of 7.4%, 5.8% and 7.0%, respectively.
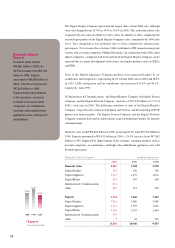
As a result, the average operating margin in 2000 was 6.2%, a decrease from W6.5% in
1999. Excluding the performance of the Information & Communications Company, which
was included in LGE operations since its merger with LG Information and
Communications in September 2000, operating profit as a percent of sales came to 7.2%
in 2000. Therefore, LGE expects substantial improvements in profitability in 2001 when
restructuring is completed.
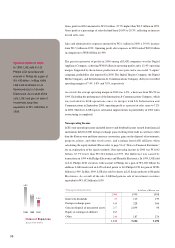
Non-operating Income
LGE's non-operating income included interest and dividend income earned from financial
instruments held by LGE; foreign exchange gains resulting from trade in currencies other
than the Korean won and from currency conversion; gains on the disposal of investments,
property, plants, and other fixed assets; and earnings from LGE affiliates when
calculating the equity method (Please refer to page 51 of “Notes to Financial Statements”
for an explanation of the equity method). Non-operating income in 2000 was W1,042
billion, 67.7% lower than W3,224 billion in 1999. The difference was caused by
transactions in 1999 with Philips Electronics and Hyundai Electronics. In 1999, LGE sold
its LG. Philips LCD securities with warrant to Philips for a gain of W1,180 billion. In
addition, LGE transferred an LCD-related patent to LG Philips LCD for gain of W281
billion in 1999. In May 1999, LGE also sold its shares in LG Semiconductor to Hyundai
Electronics. As a result of the sale, LGE had gain on sale of investment securities
equivalent to W1,102 billion in 1999.
1999
115
228
2,694
-
187
3,224
2000
67
186
257
287
244
1,042
Non-operating Income
Interest & dividends
Foreign exchange gains
Gain on disposal of noncurrent assets
Equity in earnings of affiliates
Other
1998
159
966
98
-
274
1,496
In billions of Korean won
8.0%
4.8%
2.9%
Interest Expenses
1998 1999 2000
As a percent of sales
36
Special Gains in 1999
In 1999, LGE sold its LG
Philips LCD securities with
warrant to Philips for a gain of
W1,180 billion. In May 1999,
LGE sold its shares in LG
Semiconductor to Hyundai
Electronics. As a result of the
sale, LGE had gain on sale of
investment securities
equivalent to W1,102 billion in
1 9 9 9 .