LG 2000 Annual Report Download - page 70
Download and view the complete annual report
Please find page 70 of the 2000 LG annual report below. You can navigate through the pages in the report by either clicking on the pages listed below, or by using the keyword search tool below to find specific information within the annual report.-
 1
1 -
2
-
3
-
4
-
5
-
6
-
7
-
8
-
9
-
10
-
11
-
12
-
13
-
14
-
15
-
16
-
17
-
18
-
19
-
20
-
21
-
22
-
23
-
24
-
25
-
26
-
27
-
28
-
29
-
30
-
31
-
32
-
33
-
34
-
35
-
36
-
37
-
38
-
39
-
40
-
41
-
42
-
43
-
44
-
45
-
46
-
47
-
48
-
49
-
50
-
51
-
52
-
53
-
54
-
55
-
56
-
57
-
58
-
59
-
 60
60 -
 61
61 -
 62
62 -
 63
63 -
 64
64 -
 65
65 -
 66
66 -
 67
67 -
 68
68 -
 69
69 -
 70
70 -
 71
71 -
 72
72 -
 73
73 -
 74
74 -
 75
75 -
 76
76 -
 77
77 -
 78
78 -
 79
79 -
 80
80 -
81
-
82
-
83
 |
 |

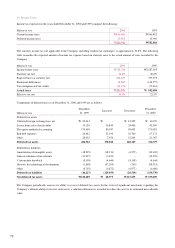
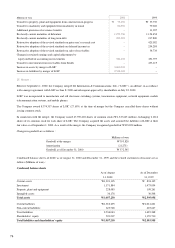
19. Income Taxes:
Income tax expenses for the years ended December 31, 2000 and 1999 comprise the following:
Millions of won 2000 1999
Current income taxes W196,960 W566,892
Deferred income taxes 29,581 15,992
W226,541 W582,884
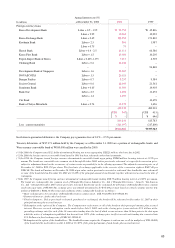
The statutory income tax rate applicable to the Company, including resident tax surcharges, is approximately 30.8%. The following
table reconciles the expected amount of income tax expense based on statutory rates to the actual amount of taxes recorded by the
Company :
Millions of won 2000 1999
Income before taxes W728,724 W2,587,905
Statutory tax rate 30.8% 30.8%
Expected taxes at statutory rate 224,447 797,075
Permanent differences 33,267 (134,777)
Tax exemption and tax credits (31,173) (79,414)
Actual taxes W226,541 W 582,884
Effective tax rate 31.1% 22.5%
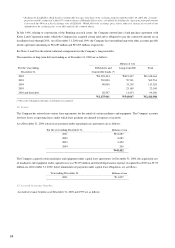
Components of deferred taxes as of December 31, 2000 and 1999 are as follows :
December December
Millions of won 31, 1999 Increases Decreases 31, 2000
Deferred tax assets
Deferred foreign exchange loss, net W 22,411 W – W 12,252 W 10,159
Losses from sales of receivables 33,130 36,845 24,406 45,569
The equity method of accounting 175,658 80,037 85,603 170,092
Bad debt expenses 24,682 53,190 10,700 67,172
Other 28,635 7,956 15,204 21,387
Deferred tax assets 284,516 178,028 148,165 314,379
Deferred tax liabilities
Amortization of intangible assets (18,299) (18,911) (4,575) (32,635)
Gain on valuation of investments (11,097) (1,421) – (12,518)
Custom duty drawback (8,198) (4,644) (8,198) (4,644)
Reserve for technological development (1,868) (97,205) (760) (98,313)
Other (6,765) (6,872) (6,977) (6,660)
Deferred tax liabilities (46,227) (129,053) (20,510) (154,770)
Net deferred tax assets W238,289 W 48,975 W127,655 W 159,609
The Company periodically assesses its ability to recover deferred tax assets. In the event of significant uncertainty regarding the
Company’s ultimate ability to recover such assets, a valuation allowance is recorded to reduce the asset to its estimated net realizable
value.
70