Kraft 2005 Annual Report Download - page 89
Download and view the complete annual report
Please find page 89 of the 2005 Kraft annual report below. You can navigate through the pages in the report by either clicking on the pages listed below, or by using the keyword search tool below to find specific information within the annual report.-
 1
1 -
2
-
3
-
4
-
5
-
6
-
7
-
8
-
9
-
10
-
11
-
12
-
13
-
14
-
15
-
16
-
17
-
18
-
19
-
20
-
21
-
22
-
23
-
24
-
25
-
26
-
27
-
28
-
29
-
30
-
31
-
32
-
33
-
34
-
35
-
36
-
37
-
38
-
39
-
40
-
41
-
42
-
43
-
44
-
45
-
46
-
47
-
48
-
49
-
50
-
51
-
52
-
53
-
54
-
55
-
56
-
57
-
58
-
59
-
60
-
61
-
62
-
63
-
64
-
65
-
66
-
67
-
68
-
69
-
70
-
71
-
72
-
73
-
74
-
75
-
76
-
77
-
78
-
 79
79 -
 80
80 -
 81
81 -
 82
82 -
 83
83 -
 84
84 -
 85
85 -
 86
86 -
 87
87 -
 88
88 -
 89
89 -
 90
90 -
 91
91 -
 92
92 -
 93
93 -
 94
94 -
 95
95 -
 96
96 -
 97
97 -
 98
98 -
 99
99 -
100
 |
 |

MERRILL CORPORATION SPAPPON// 8-MAR-06 11:26 DISK126:[06CHI5.06CHI1135]EE1135A.;14
mrll.fmt Free: 54DM/0D Foot: 0D/ 0D VJ RSeq: 1 Clr: 0
DISK024:[PAGER.PSTYLES]UNIVERSAL.BST;51
KRAFT FOODS-FSC CERTIFIED-10K/AR Proj: P1102CHI06 Job: 06CHI1135 File: EE1135A.;14
Merrill Corporation/Chicago (312) 786-6300 Page Dim: 8.250 X 10.750Copy Dim: 38. X 54.3
2004 Quarters
First Second Third Fourth
(in millions, except per share data)
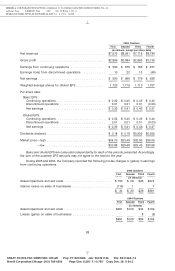
Net revenues .................................... $7,575 $8,091 $7,718 $8,784
Gross profit ..................................... $2,899 $2,984 $2,865 $3,139
Earnings from continuing operations ................... $ 550 $ 676 $ 766 $ 677
Earnings (loss) from discontinued operations ............. 10 22 13 (49)
Net earnings ..................................... $ 560 $ 698 $ 779 $ 628
Weighted average shares for diluted EPS ................ 1,720 1,715 1,710 1,707
Per share data:
Basic EPS:
Continuing operations ........................... $ 0.32 $ 0.40 $ 0.45 $ 0.40
Discontinued operations ......................... 0.01 0.01 0.01 (0.03)
Net earnings ................................. $ 0.33 $ 0.41 $ 0.46 $ 0.37
Diluted EPS:
Continuing operations ........................... $ 0.32 $ 0.40 $ 0.45 $ 0.40
Discontinued operations ......................... 0.01 0.01 0.01 (0.03)
Net earnings ................................. $ 0.33 $ 0.41 $ 0.46 $ 0.37
Dividends declared ................................ $ 0.18 $ 0.18 $0.205 $0.205
Market price—high ................................ $34.70 $33.49 $32.55 $36.06
—low................................. $30.88 $29.68 $29.45 $30.99
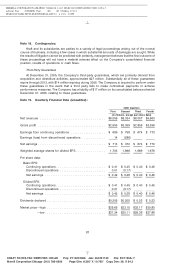
Basic and diluted EPS are computed independently for each of the periods presented. Accordingly,
the sum of the quarterly EPS amounts may not agree to the total for the year.
During 2005 and 2004, the Company recorded the following pre-tax charges or (gains) in earnings
from continuing operations:
2005 Quarters
First Second Third Fourth
(in millions)
Asset impairment and exit costs .......................... $150 $ 29 $26 $274
(Gains) losses on sales of businesses ...................... (116) 1 7
$ 34 $ 30 $26 $281
2004 Quarters
First Second Third Fourth
(in millions)
Asset impairment and exit costs ........................... $291 $129 $44 $139
Losses (gains) on sales of businesses ...................... 8 (5)
$291 $129 $52 $134
88
6 C Cs: 38132