Kraft 2005 Annual Report Download - page 78
Download and view the complete annual report
Please find page 78 of the 2005 Kraft annual report below. You can navigate through the pages in the report by either clicking on the pages listed below, or by using the keyword search tool below to find specific information within the annual report.-
 1
1 -
2
-
3
-
4
-
5
-
6
-
7
-
8
-
9
-
10
-
11
-
12
-
13
-
14
-
15
-
16
-
17
-
18
-
19
-
20
-
21
-
22
-
23
-
24
-
25
-
26
-
27
-
28
-
29
-
30
-
31
-
32
-
33
-
34
-
35
-
36
-
37
-
38
-
39
-
40
-
41
-
42
-
43
-
44
-
45
-
46
-
47
-
48
-
49
-
50
-
51
-
52
-
53
-
54
-
55
-
56
-
57
-
58
-
59
-
60
-
61
-
62
-
63
-
64
-
65
-
66
-
67
-
 68
68 -
 69
69 -
 70
70 -
 71
71 -
 72
72 -
 73
73 -
 74
74 -
 75
75 -
 76
76 -
 77
77 -
 78
78 -
 79
79 -
 80
80 -
 81
81 -
 82
82 -
 83
83 -
 84
84 -
 85
85 -
 86
86 -
 87
87 -
 88
88 -
89
-
90
-
91
-
92
-
93
-
94
-
95
-
96
-
97
-
98
-
99
-
100
 |
 |

MERRILL CORPORATION FLANGST// 9-MAR-06 02:25 DISK126:[06CHI5.06CHI1135]EA1135A.;8
mrll.fmt Free: 225D*/2905D Foot: 0D/ 0D VJ RSeq: 3 Clr: 0
DISK024:[PAGER.PSTYLES]UNIVERSAL.BST;51
KRAFT FOODS-FSC CERTIFIED-10K/AR Proj: P1102CHI06 Job: 06CHI1135 File: EA1135A.;8
Merrill Corporation/Chicago (312) 786-6300 Page Dim: 8.250 X 10.750Copy Dim: 38. X 54.3
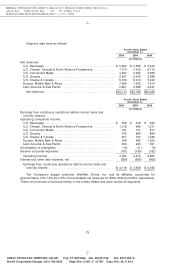
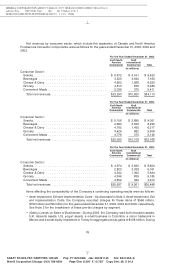
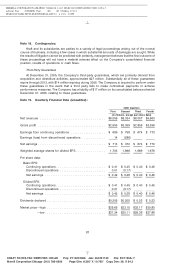
2004, the Company sold a Brazilian snack nuts business and trademarks associated with a candy
business in Norway for aggregate pre-tax losses of $3 million. During 2003, the Company sold a
European rice business and a branded fresh cheese business in Italy for aggregate pre-tax gains
of $31 million. These pre-tax (gains) losses were included in the operating companies income of
the following segments:
For the Years Ended
December 31,
2005 2004 2003
(in millions)
U.S. Cheese, Canada & North America Foodservice ............... $ (1) $— $—
U.S. Grocery ........................................... 2
Europe, Middle East & Africa ............................... (113) (5) (31)
Latin America & Asia Pacific ................................ 4 8
(Gains) losses on sales of businesses ....................... $(108) $ 3 $(31)
See Notes 5 and 6, respectively, regarding divestitures and acquisitions.
For the Years Ended
December 31,
2005 2004 2003
(in millions)
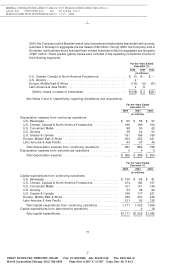
Depreciation expense from continuing operations:
U.S. Beverages ........................................ $ 60 $ 56 $ 57
U.S. Cheese, Canada & North America Foodservice ............. 166 169 154
U.S. Convenient Meals .................................. 98 90 83
U.S. Grocery .......................................... 36 54 53
U.S. Snacks & Cereals .................................. 191 186 186
Europe, Middle East & Africa .............................. 253 252 221
Latin America & Asia Pacific ............................... 63 57 45
Total depreciation expense from continuing operations .......... 867 864 799
Depreciation expense from discontinued operations ............... 2 4 5
Total depreciation expense .............................. $ 869 $ 868 $ 804
For the Years Ended
December 31,
2005 2004 2003
(in millions)
Capital expenditures from continuing operations:
U.S. Beverages ........................................ $ 135 $ 84 $ 81
U.S. Cheese, Canada & North America Foodservice ............. 214 183 157
U.S. Convenient Meals .................................. 121 121 149
U.S. Grocery .......................................... 54 48 59
U.S. Snacks & Cereals .................................. 196 177 221
Europe, Middle East & Africa .............................. 330 307 276
Latin America & Asia Pacific ............................... 121 82 126
Total capital expenditures from continuing operations ........... 1,171 1,002 1,069
Capital expenditures from discontinued operations ................ 4 16
Total capital expenditures ............................... $1,171 $1,006 $1,085
77
6 C Cs: 44518