Kraft 2005 Annual Report Download - page 20
Download and view the complete annual report
Please find page 20 of the 2005 Kraft annual report below. You can navigate through the pages in the report by either clicking on the pages listed below, or by using the keyword search tool below to find specific information within the annual report.-
 1
1 -
2
-
3
-
4
-
5
-
6
-
7
-
8
-
9
-
 10
10 -
 11
11 -
 12
12 -
 13
13 -
 14
14 -
 15
15 -
 16
16 -
 17
17 -
 18
18 -
 19
19 -
 20
20 -
 21
21 -
 22
22 -
 23
23 -
 24
24 -
 25
25 -
 26
26 -
 27
27 -
 28
28 -
 29
29 -
 30
30 -
31
-
32
-
33
-
34
-
35
-
36
-
37
-
38
-
39
-
40
-
41
-
42
-
43
-
44
-
45
-
46
-
47
-
48
-
49
-
50
-
51
-
52
-
53
-
54
-
55
-
56
-
57
-
58
-
59
-
60
-
61
-
62
-
63
-
64
-
65
-
66
-
67
-
68
-
69
-
70
-
71
-
72
-
73
-
74
-
75
-
76
-
77
-
78
-
79
-
80
-
81
-
82
-
83
-
84
-
85
-
86
-
87
-
88
-
89
-
90
-
91
-
92
-
93
-
94
-
95
-
96
-
97
-
98
-
99
-
100
 |
 |

MERRILL CORPORATION ABLIJDE// 7-MAR-06 14:42 DISK126:[06CHI5.06CHI1135]DH1135A.;4
mrll.fmt Free: 370DM/0D Foot: 0D/ 0D VJ RSeq: 1 Clr: 0
DISK024:[PAGER.PSTYLES]UNIVERSAL.BST;51
KRAFT FOODS-FSC CERTIFIED-10K/AR Proj: P1102CHI06 Job: 06CHI1135 File: DH1135A.;4
Merrill Corporation/Chicago (312) 786-6300 Page Dim: 8.250 X 10.750Copy Dim: 38. X 54.3
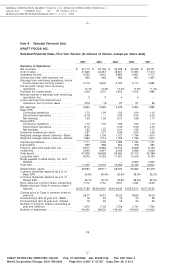
Item 6. Selected Financial Data.
KRAFT FOODS INC.
Selected Financial Data—Five Year Review (in millions of dollars, except per share data)
2005 2004 2003 2002 2001
Summary of Operations:
Net revenues ..................... $ 34,113 $ 32,168 $ 30,498 $ 29,248 $ 28,731
Cost of sales ..................... 21,845 20,281 18,531 17,463 17,310
Operating income .................. 4,752 4,612 5,860 5,961 4,717
Interest and other debt expense, net ...... 636 666 665 847 1,437
Earnings from continuing operations, before
income taxes and minority interest ...... 4,116 3,946 5,195 5,114 3,280
Pre-tax profit margin from continuing
operations ...................... 12.1% 12.3% 17.0% 17.5% 11.4%
Provision for income taxes ............ 1,209 1,274 1,812 1,813 1,484
Minority interest in earnings from continuing
operations, net ................... 3344—
(Loss) earnings from discontinued
operations, net of income taxes ....... (272) (4) 97 97 86
Net earnings ...................... 2,632 2,665 3,476 3,394 1,882
Basic EPS:
Continuing operations .............. 1.72 1.56 1.95 1.90 1.12
Discontinued operations ............ (0.16) — 0.06 0.06 0.05
Net earnings .................... 1.56 1.56 2.01 1.96 1.17
Diluted EPS:
Continuing operations .............. 1.72 1.55 1.95 1.90 1.12
Discontinued operations ............ (0.17) — 0.06 0.06 0.05
Net earnings .................... 1.55 1.55 2.01 1.96 1.17
Dividends declared per share .......... 0.87 0.77 0.66 0.56 0.26
Weighted average shares (millions)—Basic . 1,684 1,709 1,727 1,734 1,610
Weighted average shares (millions)—Diluted 1,693 1,714 1,728 1,736 1,610
Capital expenditures ................ 1,171 1,006 1,085 1,184 1,101
Depreciation ...................... 869 868 804 709 680
Property, plant and equipment, net ....... 9,817 9,985 10,155 9,559 9,109
Inventories ....................... 3,343 3,447 3,343 3,382 3,026
Total assets ...................... 57,628 59,928 59,285 57,100 55,798
Long-term debt .................... 8,475 9,723 11,591 10,416 8,134
Notes payable to Altria Group, Inc. and
affiliates ....................... — — — 2,560 5,000
Total debt ........................ 11,200 12,518 13,462 14,443 16,007
Shareholders’ equity ................ 29,593 29,911 28,530 25,832 23,478
Common dividends declared as a % of
Basic EPS ...................... 55.8% 49.4% 32.8% 28.6% 22.2%
Common dividends declared as a % of
Diluted EPS ..................... 56.1% 49.7% 32.8% 28.6% 22.2%
Book value per common share outstanding . 17.72 17.54 16.57 14.92 13.53
Market price per Class A common share—
high/low ....................... 35.65-27.88 36.06-29.45 39.40-26.35 43.95-32.50 35.57-29.50
Closing price of Class A common share at
year end ....................... 28.17 35.61 32.22 38.93 34.03
Price/earnings ratio at year end—Basic .... 18 23 16 20 29
Price/earnings ratio at year end—Diluted . . . 18 23 16 20 29
Number of common shares outstanding at
year end (millions) ................ 1,670 1,705 1,722 1,731 1,735
Number of employees ............... 94,000 98,000 106,000 109,000 114,000
19
6 C Cs: 45273