Kraft 2005 Annual Report Download - page 36
Download and view the complete annual report
Please find page 36 of the 2005 Kraft annual report below. You can navigate through the pages in the report by either clicking on the pages listed below, or by using the keyword search tool below to find specific information within the annual report.-
 1
1 -
2
-
3
-
4
-
5
-
6
-
7
-
8
-
9
-
10
-
11
-
12
-
13
-
14
-
15
-
16
-
17
-
18
-
19
-
20
-
21
-
22
-
23
-
24
-
25
-
 26
26 -
 27
27 -
 28
28 -
 29
29 -
 30
30 -
 31
31 -
 32
32 -
 33
33 -
 34
34 -
 35
35 -
 36
36 -
 37
37 -
 38
38 -
 39
39 -
 40
40 -
 41
41 -
 42
42 -
 43
43 -
 44
44 -
 45
45 -
 46
46 -
47
-
48
-
49
-
50
-
51
-
52
-
53
-
54
-
55
-
56
-
57
-
58
-
59
-
60
-
61
-
62
-
63
-
64
-
65
-
66
-
67
-
68
-
69
-
70
-
71
-
72
-
73
-
74
-
75
-
76
-
77
-
78
-
79
-
80
-
81
-
82
-
83
-
84
-
85
-
86
-
87
-
88
-
89
-
90
-
91
-
92
-
93
-
94
-
95
-
96
-
97
-
98
-
99
-
100
 |
 |

MERRILL CORPORATION ABLIJDE// 7-MAR-06 14:42 DISK126:[06CHI5.06CHI1135]DK1135A.;21
mrll.fmt Free: 190D*/240D Foot: 0D/ 0D VJ RSeq: 6 Clr: 0
DISK024:[PAGER.PSTYLES]UNIVERSAL.BST;51
KRAFT FOODS-FSC CERTIFIED-10K/AR Proj: P1102CHI06 Job: 06CHI1135 File: DK1135A.;21
Merrill Corporation/Chicago (312) 786-6300 Page Dim: 8.250 X 10.750Copy Dim: 38. X 54.3
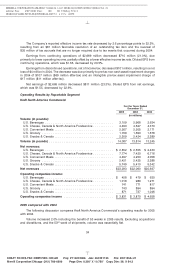
Net revenues increased $1,233 million (5.6%) due primarily to higher volume/mix ($873 million
including the benefit of the 53rd week), higher net pricing ($239 million, reflecting commodity-driven price
increases primarily on coffee, cheese, nuts and meats, partially offset by increased promotional
spending), favorable currency ($172 million) and the impact of acquisitions ($41 million), partially offset
by the impact of divestitures ($97 million).
Operating companies income decreased $39 million (1.0%), due primarily to higher marketing,
administration and research costs ($367 million, including higher benefit and marketing costs, as well as
costs associated with the 53rd week), higher fixed manufacturing costs ($94 million), the net impact of
higher implementation costs associated with the restructuring program ($15 million), the impact of
divestitures ($9 million) and unfavorable costs, net of higher pricing ($3 million, including higher
commodity costs and increased promotional spending), partially offset by favorable volume/mix
($364 million, including the benefit of the 53rd week), lower pre-tax charges for asset impairment and exit
costs ($56 million) and favorable currency ($31 million).
The following discusses operating results within each of Kraft North America Commercial’s
reportable segments.
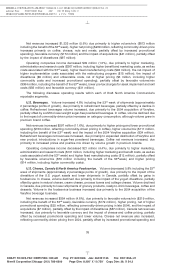
U.S. Beverages. Volume increased 4.8% including the 53rd week of shipments (approximately
2 percentage points of growth), due primarily to refreshment beverages, partially offset by a decline in
coffee. Refreshment beverages volume increased, due primarily to the 2004 acquisition of Veryfine,
partially offset by a shift to lower weight sugar-free powdered beverages. In coffee, volume declined due
to the impact of commodity-driven price increases on category consumption, although volume grew in
premium brand coffee.
Net revenues increased $297 million (11.6%), due primarily to higher pricing and lower promotional
spending ($150 million, reflecting commodity-driven pricing in coffee), higher volume/mix ($111 million,
including the benefit of the 53rd week) and the impact of the 2004 Veryfine acquisition ($34 million).
Refreshment beverages net revenues increased, due primarily to expanded distribution of Veryfine and
new product introductions in sugar-free powdered beverages. Coffee net revenues increased, due
primarily to increased prices and positive mix driven by volume growth in premium brands.
Operating companies income decreased $21 million (4.4%), due primarily to higher marketing,
administration and research costs ($101 million, including higher marketing and benefit costs, as well as
costs associated with the 53rd week) and higher fixed manufacturing costs ($12 million), partially offset
by favorable volume/mix ($76 million including the benefit of the 53rdweek) and higher pricing
($14 million, including higher commodity costs).
U.S. Cheese, Canada & North America Foodservice. Volume decreased 0.8% including the 53rd
week of shipments (approximately 2 percentage points of growth), due primarily to the impact of the
divestiture of the U.S. yogurt assets and lower shipments in Canada, partially offset by gains in
foodservice. In cheese, volume declined due primarily to the impact of the yogurt divestiture, partially
offset by gains in natural cheese, cream cheese, process loaves and cottage cheese. Volume declined
in Canada, due primarily to lower shipments of grocery products, ready-to-drink beverages, coffee and
desserts. Volume in the foodservice business increased due primarily to the 2004 acquisition of the
Veryfine beverage business.
Net revenues increased $354 million (4.8%), due primarily to favorable volume/mix ($219 million,
including the benefit of the 53rd week), favorable currency ($172 million), higher pricing, net of higher
promotional spending ($25 million, reflecting commodity-driven pricing in late 2004), and the impact of
acquisitions ($7 million), partially offset by the impact of divestitures ($67 million). Canada net revenues
increased, due primarily to favorable currency and the impact of cheese and coffee pricing, partially
offset by increased promotional spending and lower volume. Cheese net revenues also increased,
reflecting commodity-driven pricing from 2004, partially offset by increased promotional spending and
35
6 C Cs: 55238