Kraft 2005 Annual Report Download - page 39
Download and view the complete annual report
Please find page 39 of the 2005 Kraft annual report below. You can navigate through the pages in the report by either clicking on the pages listed below, or by using the keyword search tool below to find specific information within the annual report.-
 1
1 -
2
-
3
-
4
-
5
-
6
-
7
-
8
-
9
-
10
-
11
-
12
-
13
-
14
-
15
-
16
-
17
-
18
-
19
-
20
-
21
-
22
-
23
-
24
-
25
-
26
-
27
-
28
-
 29
29 -
 30
30 -
 31
31 -
 32
32 -
 33
33 -
 34
34 -
 35
35 -
 36
36 -
 37
37 -
 38
38 -
 39
39 -
 40
40 -
 41
41 -
 42
42 -
 43
43 -
 44
44 -
 45
45 -
 46
46 -
 47
47 -
 48
48 -
 49
49 -
50
-
51
-
52
-
53
-
54
-
55
-
56
-
57
-
58
-
59
-
60
-
61
-
62
-
63
-
64
-
65
-
66
-
67
-
68
-
69
-
70
-
71
-
72
-
73
-
74
-
75
-
76
-
77
-
78
-
79
-
80
-
81
-
82
-
83
-
84
-
85
-
86
-
87
-
88
-
89
-
90
-
91
-
92
-
93
-
94
-
95
-
96
-
97
-
98
-
99
-
100
 |
 |

MERRILL CORPORATION ABLIJDE// 7-MAR-06 14:42 DISK126:[06CHI5.06CHI1135]DK1135A.;21
mrll.fmt Free: 110D*/300D Foot: 0D/ 0D VJ RSeq: 9 Clr: 0
DISK024:[PAGER.PSTYLES]UNIVERSAL.BST;51
KRAFT FOODS-FSC CERTIFIED-10K/AR Proj: P1102CHI06 Job: 06CHI1135 File: DK1135A.;21
Merrill Corporation/Chicago (312) 786-6300 Page Dim: 8.250 X 10.750Copy Dim: 38. X 54.3
($85 million, including higher commodity costs), the 2004 pre-tax charges for asset impairment and exit
costs ($9 million) and the 2004 implementation costs associated with the restructuring program
($4 million), partially offset by higher volume/mix ($49 million).
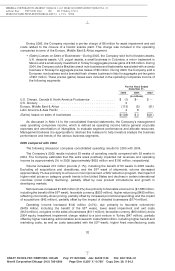
U.S. Cheese, Canada & North America Foodservice. Volume increased 3.5%, due primarily to
higher volume in foodservice and cheese. Volume in the foodservice business increased, due primarily
to an acquisition of a beverage business in 2004 and higher shipments to national accounts. Cheese
volume also increased, benefiting from increased promotional spending.
Net revenues increased $704 million (10.5%), due primarily to higher volume/mix ($272 million),
higher pricing, net of higher promotional reinvestment spending in cheese ($248 million, reflecting
commodity-driven pricing), favorable currency ($164 million) and the impact of acquisitions. Cheese
revenues increased due primarily to increased shipments and commodity-driven pricing, partially offset
by increased promotional spending. In Canada, net revenues also increased due to cheese pricing.
Foodservice net revenues increased, due primarily to commodity-driven net pricing in cheese and meat,
and higher shipments.
Operating companies income decreased $282 million (22.2%), due primarily to unfavorable costs,
net of higher pricing ($214 million, including higher commodity costs and increased promotional
spending), the 2004 pre-tax charges for asset impairment and exit costs ($111 million), higher fixed
manufacturing costs ($50 million, including higher benefit costs), higher marketing, administration and
research costs ($26 million) and the 2004 implementation costs associated with the restructuring
program ($8 million), partially offset by higher volume/mix ($99 million) and favorable currency
($29 million).
U.S. Convenient Meals. Volume increased 1.6%, due primarily to gains in meats and pizza,
partially offset by lower shipments in meals. Meats volume increased driven by higher consumption of
cold cuts, supported by higher investment spending. Pizza volume also increased, aided by new
product introductions. In meals, volume declined due to the discontinuation of certain product lines in
the second half of 2003.
Net revenues increased $192 million (4.7%), due primarily to higher volume/mix ($114 million),
higher pricing ($75 million, reflecting commodity-driven pricing in meats and pizza) and the impact of
acquisitions. Meats net revenues increased due primarily to higher shipments of cold cuts, bacon and
hot dogs, and commodity-driven pricing. In pizza, net revenues were higher due to new product
introductions and commodity-driven pricing actions. Meals net revenues increased slightly as the
impact of higher shipments of dinners was partially offset by the discontinuation of a product line.
Operating companies income decreased $46 million (5.6%), due primarily to the 2004 pre-tax
charges for asset impairment and exit costs ($41 million), higher marketing, administration and research
costs ($38 million, including higher benefit costs), the impact of acquisitions ($5 million) and the 2004
implementation costs associated with the restructuring program ($4 million), partially offset by higher
volume/mix ($40 million) and higher pricing, net of unfavorable costs ($7 million, including higher
commodity costs).
U.S. Grocery. Volume increased 0.7%, due primarily to gains in enhancers, partially offset by a
decline in desserts. Volume increased in enhancers, due primarily to mayonnaise and salad dressings.
In desserts, volume declined, due primarily to lower shipments of fruit snacks, partially offset by higher
shipments in frozen toppings.
Net revenues increased $37 million (1.5%), due primarily to higher pricing and lower promotional
spending ($34 million) and higher volume/mix. In enhancers, net revenues increased due primarily to
higher shipments of pourable and spoonable salad dressings. Desserts net revenues increased due
primarily to lower promotional spending for new product introductions and favorable mix from sugar-free
desserts.
38
6 C Cs: 12230