Kraft 2005 Annual Report Download - page 4
Download and view the complete annual report
Please find page 4 of the 2005 Kraft annual report below. You can navigate through the pages in the report by either clicking on the pages listed below, or by using the keyword search tool below to find specific information within the annual report.-
 1
1 -
 2
2 -
 3
3 -
 4
4 -
 5
5 -
 6
6 -
 7
7 -
 8
8 -
 9
9 -
 10
10 -
 11
11 -
 12
12 -
 13
13 -
 14
14 -
 15
15 -
16
-
17
-
18
-
19
-
20
-
21
-
22
-
23
-
24
-
25
-
26
-
27
-
28
-
29
-
30
-
31
-
32
-
33
-
34
-
35
-
36
-
37
-
38
-
39
-
40
-
41
-
42
-
43
-
44
-
45
-
46
-
47
-
48
-
49
-
50
-
51
-
52
-
53
-
54
-
55
-
56
-
57
-
58
-
59
-
60
-
61
-
62
-
63
-
64
-
65
-
66
-
67
-
68
-
69
-
70
-
71
-
72
-
73
-
74
-
75
-
76
-
77
-
78
-
79
-
80
-
81
-
82
-
83
-
84
-
85
-
86
-
87
-
88
-
89
-
90
-
91
-
92
-
93
-
94
-
95
-
96
-
97
-
98
-
99
-
100
 |
 |

MERRILL CORPORATION MBLOUNT// 9-MAR-06 14:03 DISK126:[06CHI5.06CHI1135]DE1135A.;25
mrll.fmt Free: 33DM/0D Foot: 0D/ 0D VJ RSeq: 3 Clr: 0
DISK024:[PAGER.PSTYLES]UNIVERSAL.BST;51
KRAFT FOODS-FSC CERTIFIED-10K/AR Proj: P1102CHI06 Job: 06CHI1135 File: DE1135A.;25
Merrill Corporation/Chicago (312) 786-6300 Page Dim: 8.250 X 10.750Copy Dim: 38. X 54.3
(c) Narrative Description of Business
Markets and Products
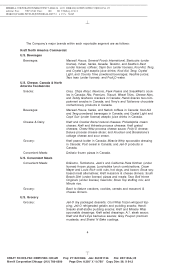
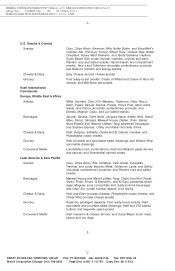
The Company’s brands span five consumer sectors, as follows:
•Snacks—primarily cookies, crackers, salted snacks and chocolate confectionery;
•Beverages—primarily coffee, aseptic juice drinks, flavored water and powdered beverages;
•Cheese & Dairy—primarily natural, process and cream cheeses;
•Grocery—primarily ready-to-eat cereals, enhancers and desserts; and
•Convenient Meals—primarily frozen pizza, packaged dinners, lunch combinations and
processed meats.
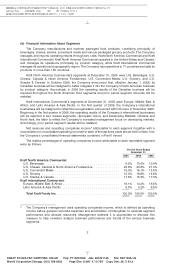
The following table shows each reportable segment’s participation in these five core consumer
sectors.
Percentage of 2005 Net Revenues by Consumer Sector(2)
Cheese & Convenient
Segment(1) Snacks Beverages Dairy Grocery Meals Total
Kraft North America Commercial:
U.S. Beverages ................ 39.8% 8.4%
U.S. Cheese, Canada & North
America Foodservice .......... 8.2% 6.6% 74.7% 20.0% 10.3% 22.8%
U.S. Convenient Meals ........... 0.1% 0.2% 82.8% 13.2%
U.S. Grocery .................. 1.8% 40.9% 7.1%
U.S. Snacks & Cereals ........... 46.3% 1.3% 22.9% 16.8%
Total Kraft North America
Commercial ............... 56.4% 46.4% 76.0% 84.0% 93.1% 68.3%
Kraft International Commercial:
Europe, Middle East & Africa ...... 32.2% 44.3% 16.6% 6.9% 5.4% 23.4%
Latin America & Asia Pacific ....... 11.4% 9.3% 7.4% 9.1% 1.5% 8.3%
Total Kraft International
Commercial ............... 43.6% 53.6% 24.0% 16.0% 6.9% 31.7%
Total Kraft Foods Inc. ............ 100.0% 100.0% 100.0% 100.0% 100.0% 100.0%
Consumer Sector Percentage of
Total Kraft Foods Inc. ......... 27.9% 21.0% 19.1% 16.1% 15.9% 100.0%
(1) The amounts of net revenues, total assets and long-lived assets attributable to each of the
Company’s geographic regions and the amounts of net revenues and operating companies income
of each of the Company’s reportable segments for each of the last three years are set forth in
Note 14 to the Company’s consolidated financial statements contained in Part II hereof.
(2) Percentages are calculated based upon dollars rounded to millions.
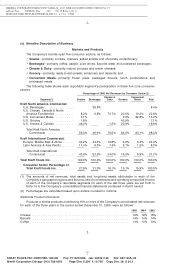
Additional Product Disclosure
Products or similar products contributing 10% or more of the Company’s consolidated net revenues
for each of the three years in the period ended December 31, 2005, were as follows:
2005 2004 2003
Cheese ..................................................... 19% 19% 18%
Biscuits ..................................................... 14% 14% 14%
Coffee ...................................................... 14% 13% 13%
3
6 C Cs: 12022